Author note: As a real estate fund manager myself, this is not just an academic exercise for me like it might be for others. One of the things that both my business partner Jim and I have really tried to design into our funds is timing. For example, if you bought a dot com investment in 1995, it was a good time. But if you bought a dot com investment in 2000, it was not a good time. So, what time is it?
We always want to know what time it is because we want to have the benefit of the “wind at our backs,” so to speak. We pay attention to what we call the economic tides, or bigger waves affecting the economic story, and that’s what we cover in our economic updates. So let’s dive in.
Where the Economy is at Currently
A hot-button topic circulating through the press and dinner table conversation alike is inflation. A lot of people are concerned about inflation with the Fed printing a lot of money over the last year as part of its stimulus measures. Is this something we should be worried about?
Let’s look at the data.
How is the average US citizen faring financially?
Personal Income per Capita Hit All-Time High
I’ve never seen anything like this in my decades of studying economics. You can see in 2020 there was a hocky-stick rise to a new personal income record. In looking at the underlying data, this increase is purely because of the stimulus.
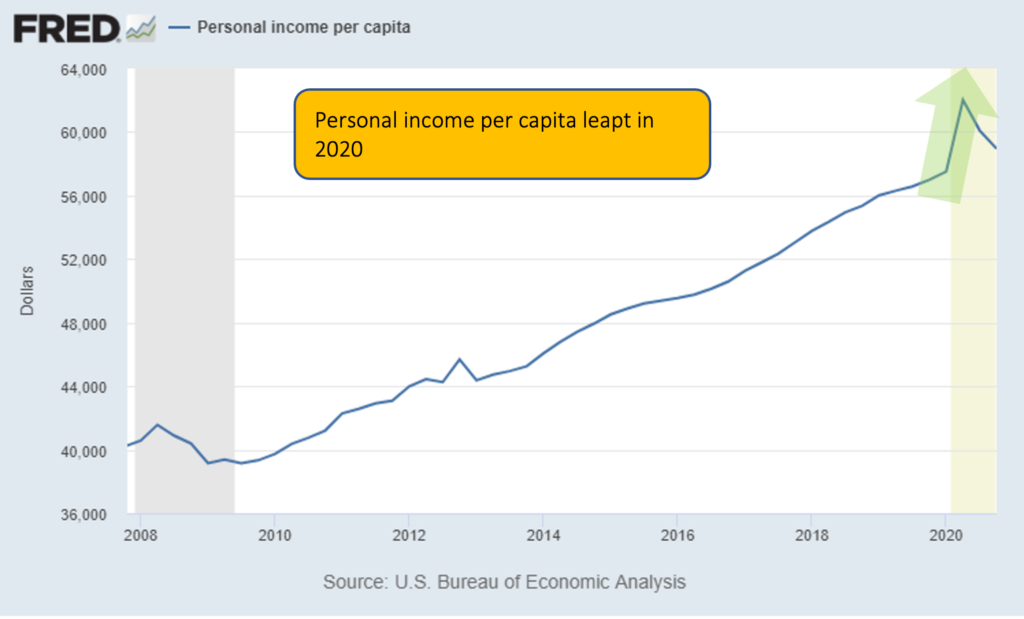
While there were many, many people suffering financially from the pandemic, data shows that the US population on average is seeing record levels of income. The debt service chart below shows this from another angle.
Debt Service Payments at 4-Decade Low
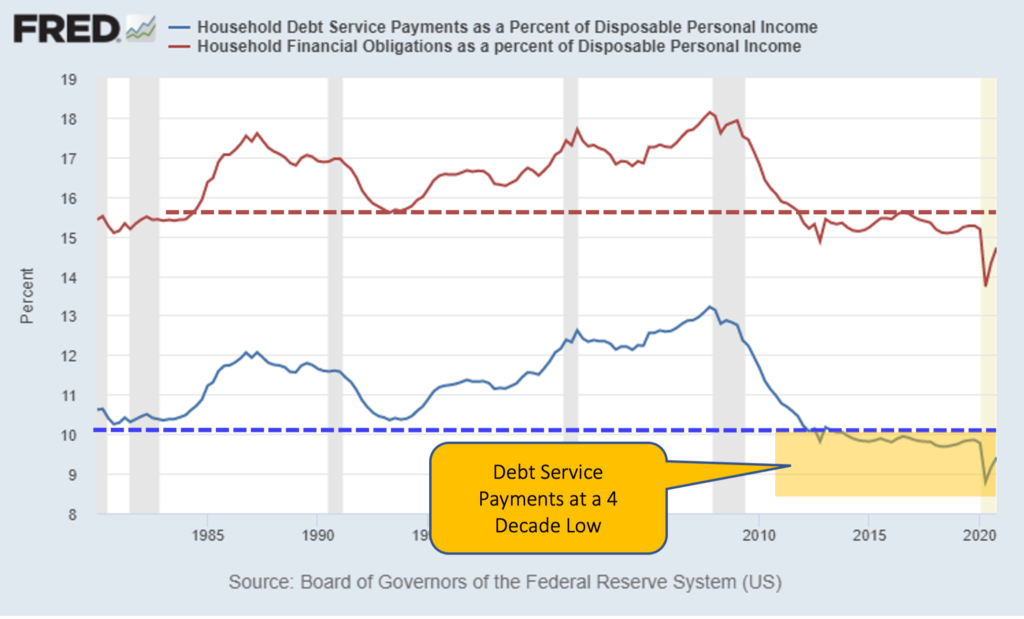
Look at 2020. As soon as Covid-19 hit, we see an immediately drop in debt service payments. Debt service refers to what percentage of disposable income is used toward debt payments. So, with the stimulus payments in 2020, US residents had extra cash. And because of the pandemic, they weren’t traveling or going out to eat. Instead, they paid down debt and saved money. Debt service payments are lower now than they’ve been for 30 years.
Refinances at Record-High
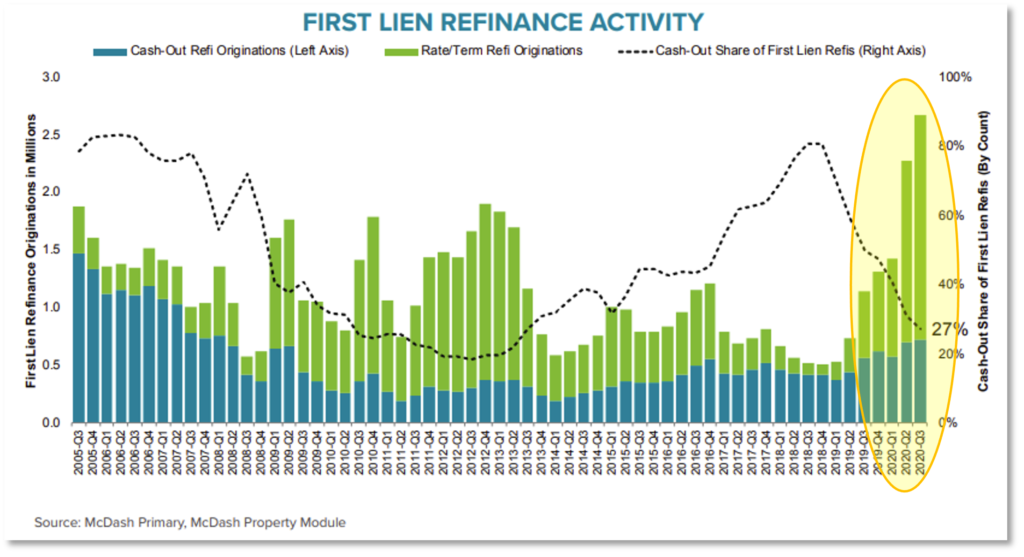
In this chart looking at refinances, in 2020 there was a record 9 million mortgage refinances, many of which were cash-out refinances. So not only are personal income increasing and debt payments dropping, but people are putting more and more cash into their pockets by taking out equity in their properties.
Household Net Worth at New Record
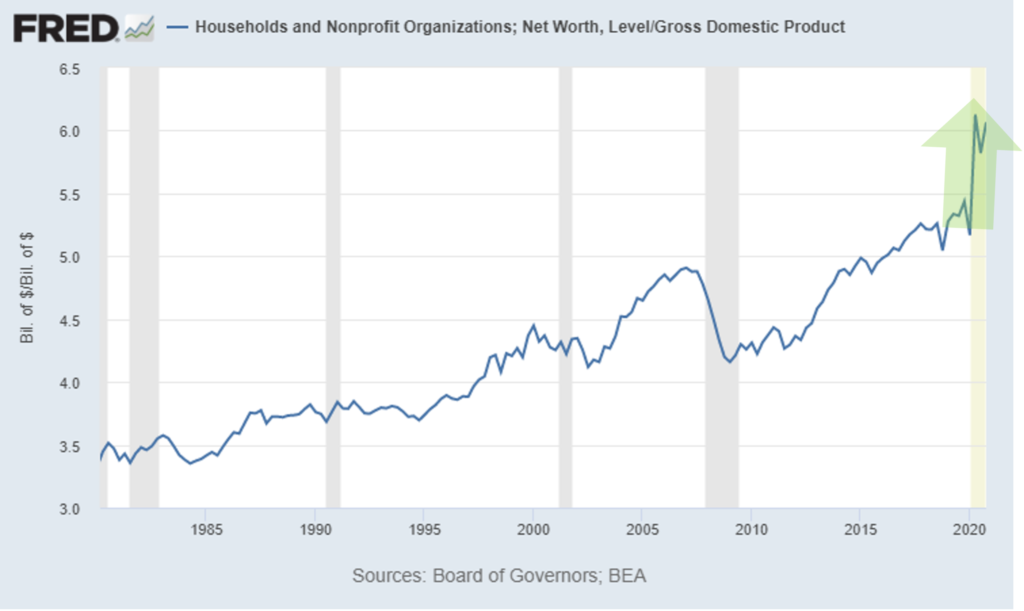
Household net worth is another metric that experienced a hockey stick-rise in 2020. The large increase is primarily due to paying off debt, gains in home prices, and gains in the stock market, all of which improves net worth.
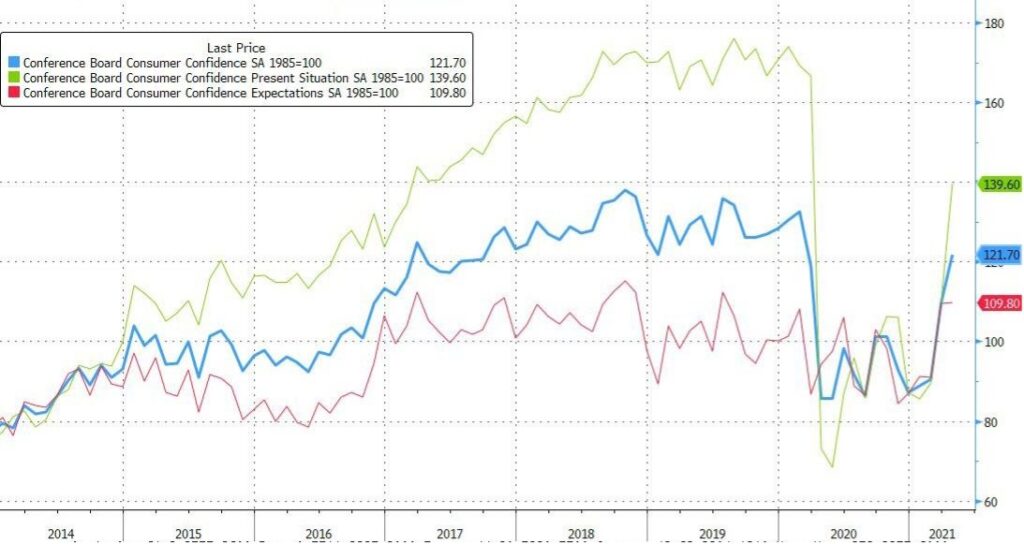
This rise in net worth produces what is called the wealth effect, where people feel like they have resources. This, in turn, creates consumer confidence. Consumer confidence has recovered back to where it was in 2017, meaning people are becoming optimistic again. This is an important metric because 70% of the US economy is driven by consumer spending. The chart below shows consumer’s confidence levels.
Consensus GDP
GDP growth expectations are shown in the chart below, with an expected 8.1% growth in Q2 2021 and 7.0% growth in Q3. This is based on an annualized basis, meaning they expect a fourth of that to occur each quarter. This level of growth is incredible. Normal growth for a mature economy like the US is between 2 and 4% each year.
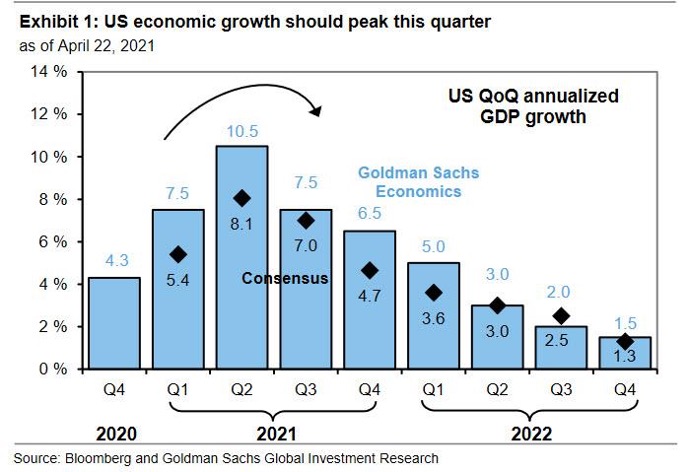
So what’s happening now? In 2020 we had a massive dip in GDP because of the pandemic, hitting a depression-era low. Now in 2021, we’re seeing the recovery. After the big jump this quarter, it will start to taper off back to normal growth levels.
Economic Bottom Line
But my opinion is that the GDP growth will exceed everybody’s expectations. I think we’ll see blistering growth. Why? Because of a combination of all the things I mentioned: record per capita income, record savings, record net worth, record cash-out refis, record low debt service, consumer sentiment surge, and cash/profit from stimulus payments. Combine this with freedom from cabin fever as more local and international economies open to tourists, and I believe we’ll see lots of consumer spending.
Inflation
So what about inflation? Let’s take a look at lumber, agriculture, used vehicles, and copper. Copper is a very good predictor of economic growth because it is used in almost every kind of industrial application, like electronics and plumbing.
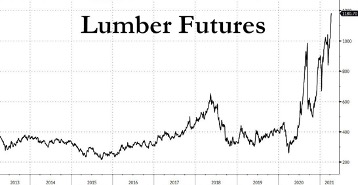
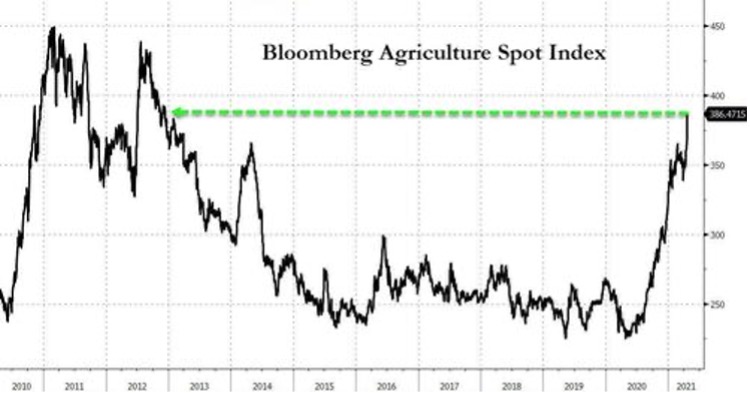
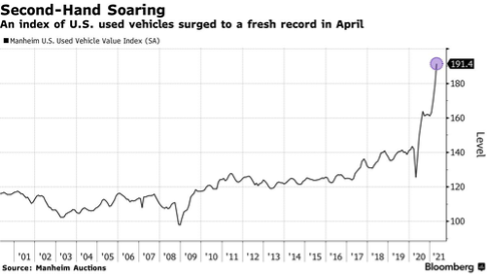
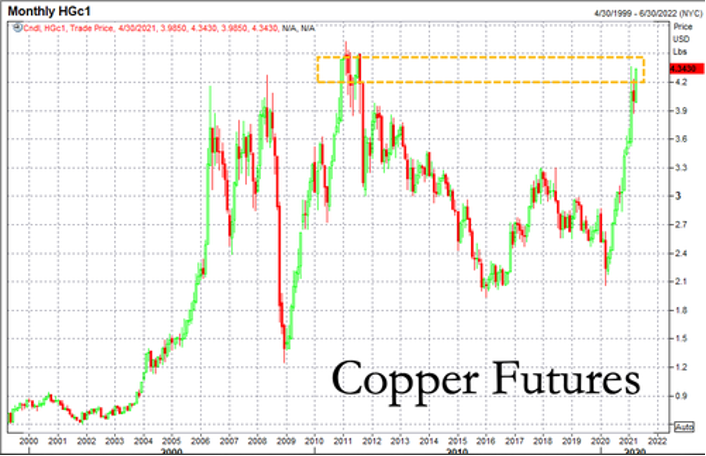
As you can see, everything is soaring. Prices are spiking, and there is a large amount of supply chain disruptions and worker shortages underlying this.
Small Businesses See Growth, Expect Pressures in 2021
A Federal Reserve Bank of Kansas City report in April showed that 70% of firms indicated selling prices are higher compared to pre-pandemic levels, mostly due to increasing materials prices. And 50% of firms reported higher new orders compared to before the pandemic. That means 50% of firms are saying their sales are higher than before the pandemic.
The below chart taken from that report showed that 60% of these companies consider a lack of qualified workers to be their biggest risk for future business over the next year, tied with supply chain issues.
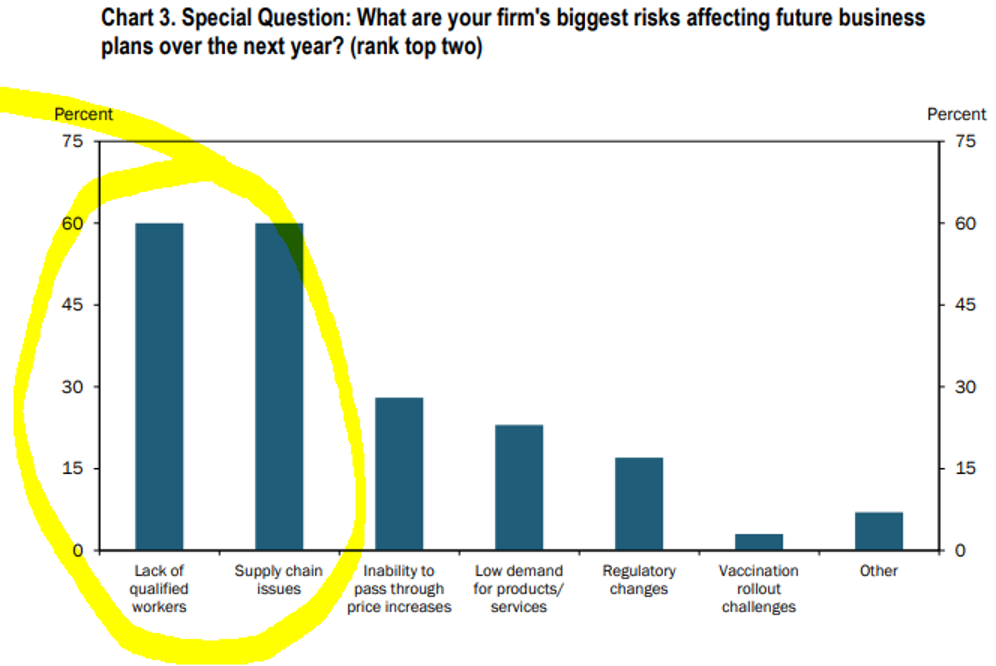
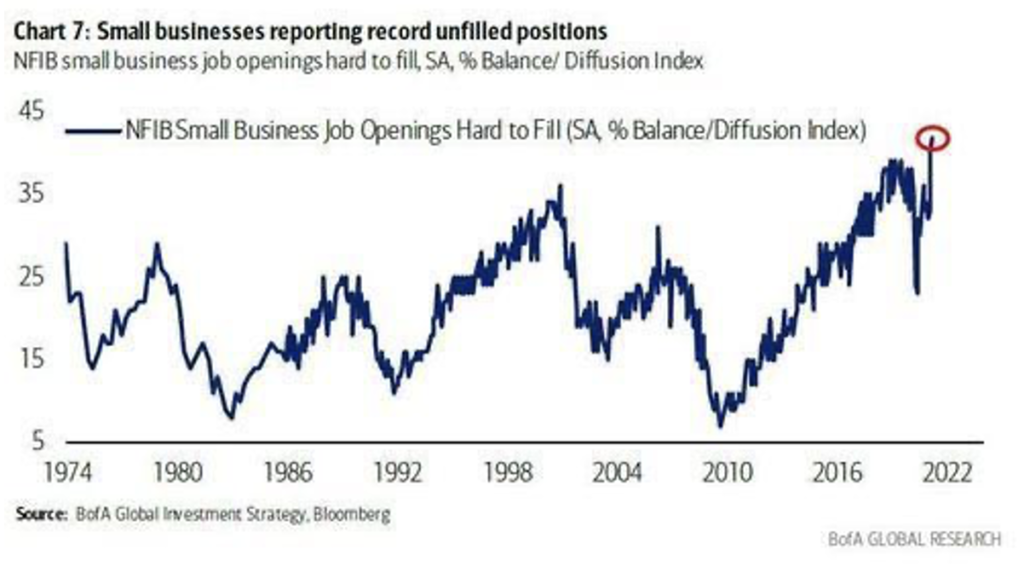
Over half of businesses are saying they’re having trouble finding workers to fill job openings.
These comments from the Federal Reserve Bank of Kansas City report shows that stimulus measures are affecting the labor pool.
“Stimulus and increased unemployment money are wrecking the labor pool. Lower-level employees are quitting to make just as much not working.”
“Unemployed workers have no incentive to return to work given the COVID bonus payments.”
“Entry level pay will need to be increased. This will create pressure on all other positions.”
“It is very difficult to handle the increased business with supply chain issues across all materials and finding anyone who wants to work. The federal government has incentivized people to stay home and not be productive.”
“The labor shortage is driving up the price of most proteins in food manufacturing.”
“Liquidity is the BIGGEST issue. Ramp up of production is stressing cash more than usual since we depleted cash during the downturn more than what would have been typical.”
“We are facing significant supply chain problems due to COVID-19 issues, tariff issues, and the weather problems in Texas earlier his year.”
What about Interest Rates?
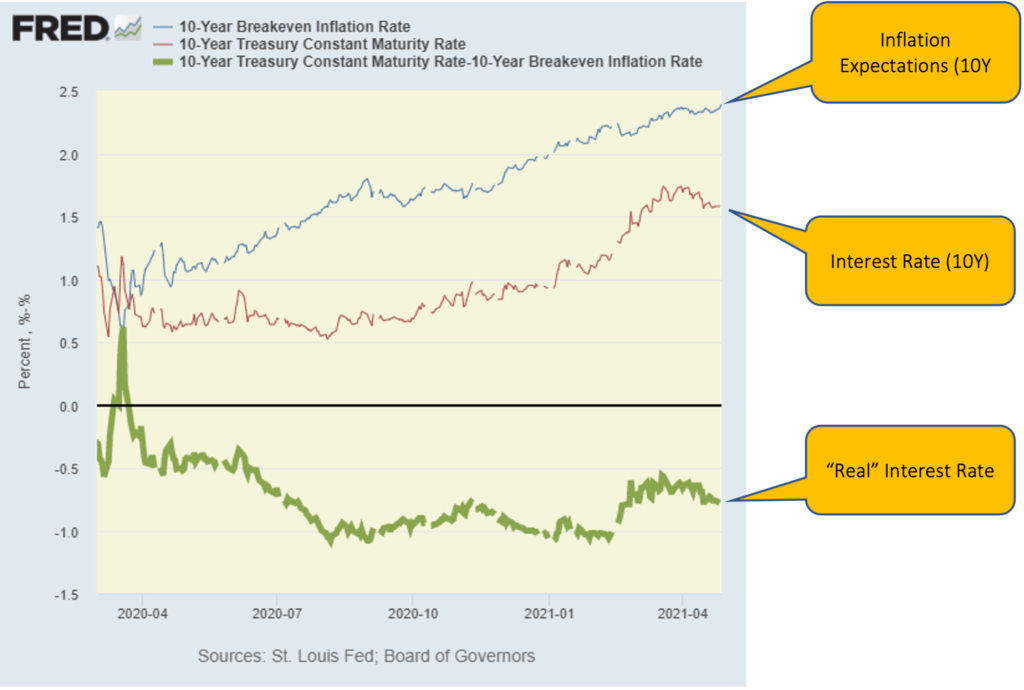
The top blue line in the chart above is the inflation expectations, called the 10-year breakeven rate. It’s basically a formula that calculates how much inflation premium is built into the price of a bond. They calculated it by measuring the difference between the yield of a nominal bond and an inflation-linked bond of the same maturity. It is essentially investors’ expectations on inflation, mathematically speaking.
The red line is the nominal interest rate, and the different between those two is the green line, or “real” interest rate, which measures what you’re actually earning on your money after adjusting for inflation. The black line being zero, you can see that real rates are still expected to be negative. During the period in the yellow box, inflation expectations stayed fairly flat, but the real rate went up. The real rate went up because investors were moving out of pandemic-era defensive bond positions. This indicates is an expectation of a return to pre-pandemic regular economic growth, rather than an expectation of future inflation.
Will We See Inflation Coming in a Big Way?
I’ve gone into this is great depth before, but there are 4 systemic deflationary forces that are still in place today. Systemic forces means they are widespread and will not easily change. The first is wages.
Wages
Wage growth is highly capped because of automation. McKinsey projects that in the next 10 years, a third to almost a half of jobs will disappear because job hours are being automated. Think about the kiosk at McDonald’s that takes your order now instead of a person. This automation eliminates jobs and creates a downward pressure on wages.
Globalization is another wage deflator. Many US jobs can be replaced overseas for less, so essentially, every US worker competes with an overseas worker at far less money. As long as this is true, wages are capped.
Food
This chart looks at world grain production since 1950. You can see the amount of grain land harvested drop dramatically, while the grain yields per hectare increase at the same pace.
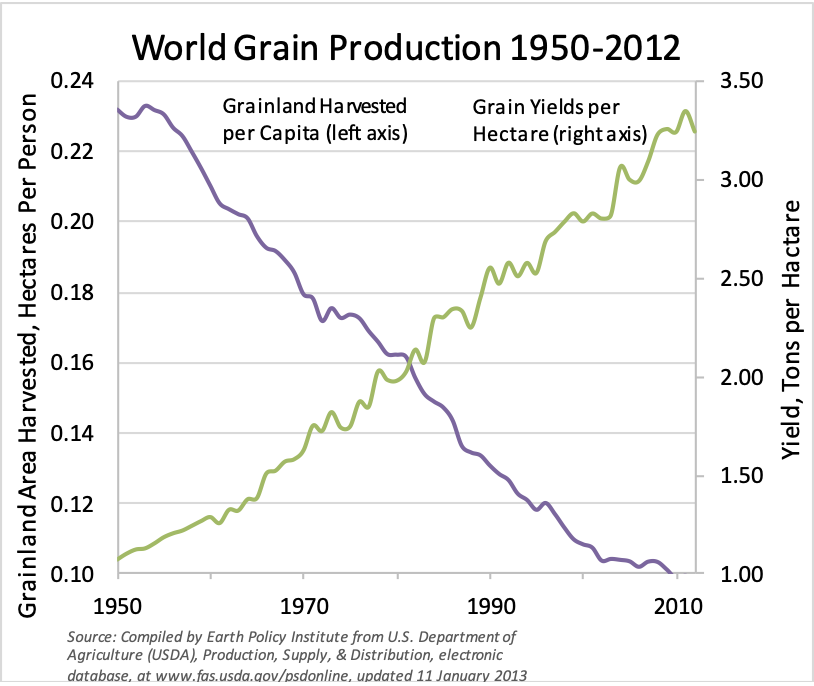
Less and less land is producing more and more grain. This is largely the result of advances in biotechnology. Tech growth is massively improving productivity and yields, and this trend is not going to change anytime soon.
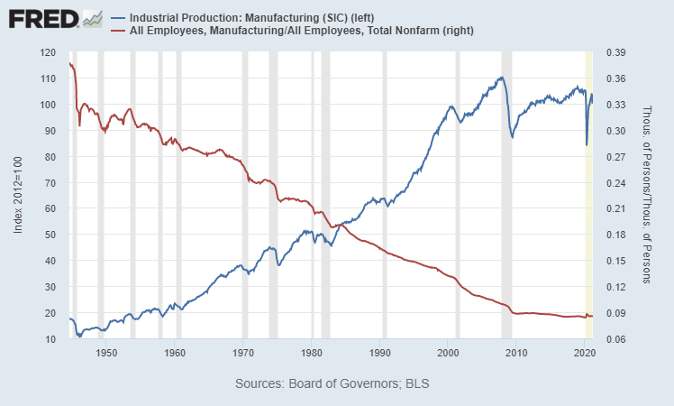
Energy
Data from the US government shows that primary energy production has risen sharply, again due to advances in technology. But if you look at consumption, it’s flattened. This is primarily due to conservation efforts like electric vehicles, renewable energy, etc. For the first time, we’ve recently seen energy production overtake consumption in America.
Energy is a long-term deflationary force because of technology advances, like fracking, for instance, that hasn’t yet been deployed in other high-energy-producing countries like Russia, Siberia and Saudi Arabia. The higher oil runs in price, the more producers will be incentivized to deploy these new technologies. This will cap prices.
Demographics
An aging population and declining labor force growth rate acts as another cap on inflation rates. Inflation is highly correlated to the age of the workforce, as you can see from the chart below showing the consumer price index (CPI) and labor force growth rates. As the workforce ages and retires, they are not contributing to GDP anymore and consumer prices stay steady.
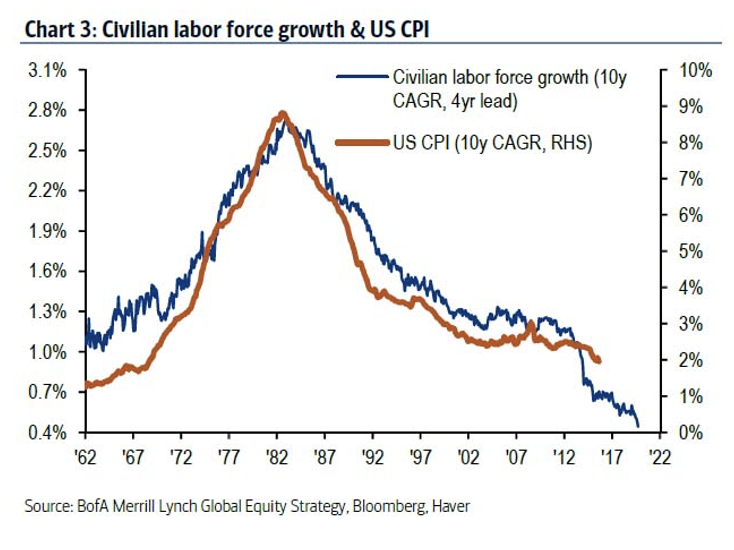
These are big inflationary components that are in a systemic deflationary cycle. The one anomaly is housing, which makes up about one third of the CPI. Housing is a large inflationary component, and it does continue to grow, but I believe that generally inflation will not be as big a problem as many are thinking because of these dramatic, long-term deflationary forces in place.
What about the Fed printing money?
The chart below is a snapshot of the Federal Reserves’ total assets over the last 10 years, the period of greatest monetary expansion in history.
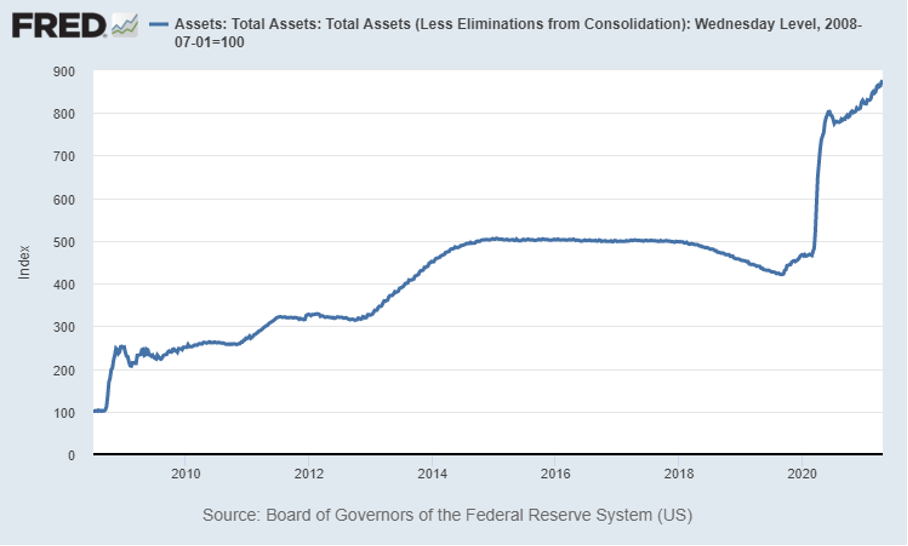
The sharp inclines are when the Fed prints more money, which has increased steadily over the last 10 years. But take a look at the same chart with gold, CPI, and inflation included.
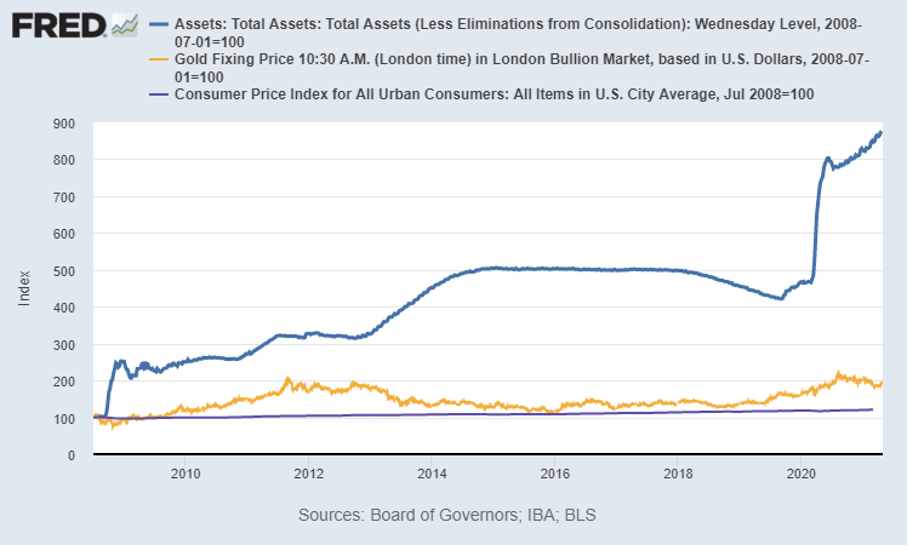
Asset prices rose, but the real economy did not. Inflation did not hit consumer prices, but it did raise asset prices. All the liquidity that the Fed printed does not go into buying more consumer goods, but rather into buying assets.
Now, that may shift a little bit with the new stimulus package methodology of direct-to-consumer. Historically, government stimulus measures were in the form of tax breaks (for corporations among other things), and you would see a trickle down to the end consumer. But in this case, a consumer with $1,000 in his pocket, may go to the Apple store and spend it.
Basically, I believe we will see increasing inflation primarily due to supply and demand shortages because of supply chain change, disruptions, and labor shortages. But I expect that inflation pressure to ease in 6-9 months as supply chain disruptions are solved and expanded unemployment benefits end. So, workers get back to work and supply chain kinks are worked out.
Inflation Bottom Line
- We will see increasing inflation primarily due to increased demand and supply shortages (supply chain disruptions and labor shortages) in the short term
- We expect to see inflation pressures ease as supply chain disruptions are solved and expanded unemployment benefits end
- Consumer Price Inflation will be boosted by stimulus –
direct payments (a first) have a more immediate effect than other stimulus measures - Unemployment rates will continue to be higher until benefits expire
- Higher unemployment may cause Fed to keep rates low

Mr. Fraser has 20+ years’ experience as a finance and technology executive and is a former E&Y Entrepreneur of the Year Award winner. In 2012 Fraser co-founded Aspen Funds, a fund management company focused on mortgage investments. Fraser is responsible for financial management, portfolio modeling, as well as systems and processes, designing and deploying Aspen’s scalable state-of-the-art back-end platform.