Periodically, Aspen Funds will publish a new economic forecast report focused on macro-economic trends. Aspen Co-Founder and CFO, Bob Fraser, has written economic newsletters for many years, and is a well-respected authority, having helped thousands navigate through the changing economic cycles. He has an impressive track record forecasting trends related to real estate, currencies, commodities and the stock market. This 6-part series focuses on economic predictions as we head in 2021, and will cover the economy, Covid19 recovery, proposed Biden tax plan, real estate, the stock market, and Aspen Funds.
My Economics Approach
I have been studying and forecasting economic trends for more than 20 years. And my focus over that time has always been to look at what I call ‘tides.’ There’s a lot of noise in this information age, and despite having access to more information than ever, it can be extremely difficult to sort through the fluff. Much of what we’re hearing is what I call the ‘waves,’ or micro trends that come and go more quickly. But what I like to focus on is the tides, the big picture elements, that are very slow-moving, inexorable movements with big impact. This economic series will take a look at what the economy will look like in 2021, and provide economic predictions for the coming year and beyond.
The COVID Economy — Where We Are At
2020 was an extremely pivotal year with the COVID crisis and a new incoming president, possibly bringing a new tax plan with him. We’ll dive more into both these topics, along with others, but in this first part of the series, we’ll look at the general economy.
Working From Home Trends 2020
One of the biggest trends we saw last year as a result of the COVID crisis was a new work-from-home reality that so much of the workforce experienced. The below chart is from Kastle Systems who manages key card systems in 2,681 office buildings which gives us a good indication of work-from-home trends across the US.
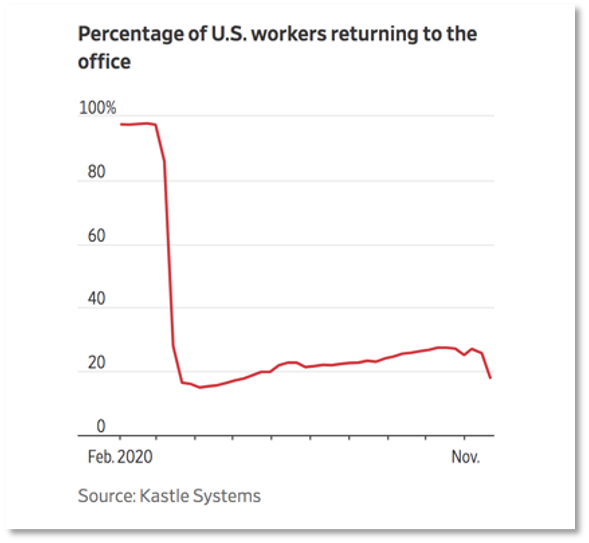
According to them, we’re seeing about 80% of US office workers currently working from home. This shift has a pretty major impact on many facets of the economy.
Hardest-hit Sectors
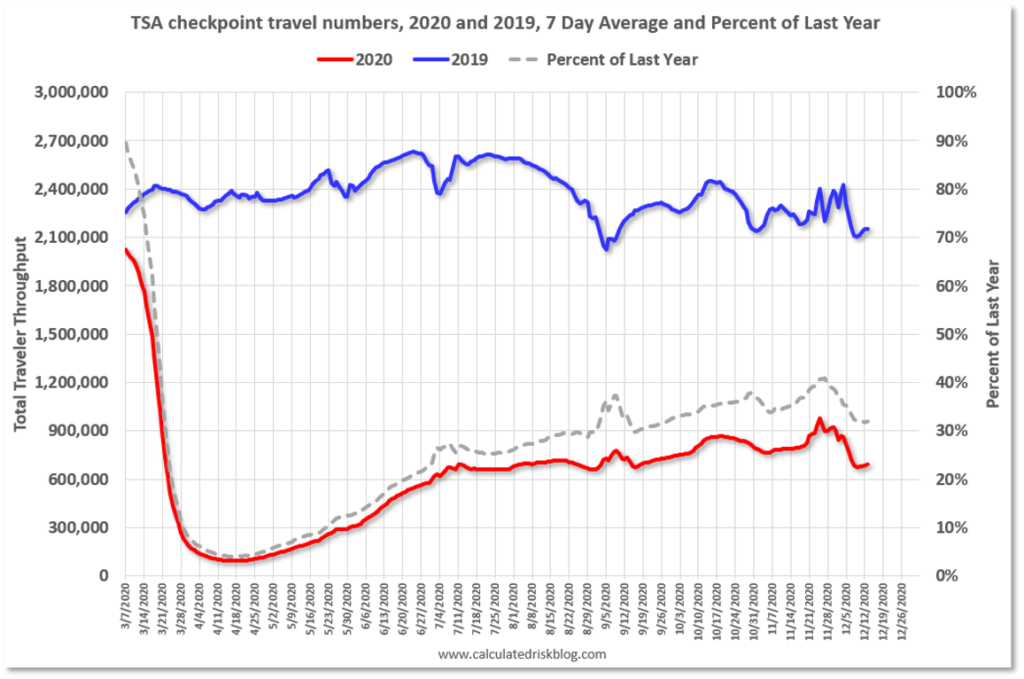
Travel Still Down 70%
According to TSA, travel is still down about 70% since the start of the pandemic, though this number has improved from a 95% drop in April last year.
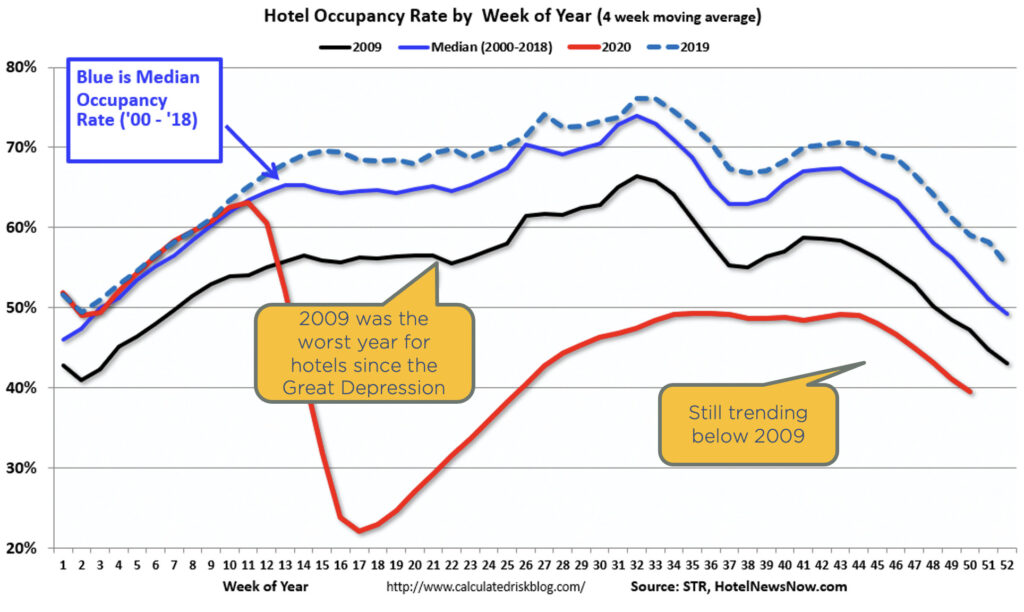
Lodging, another hard-hit sector, is down 38% year over year. The black line in the chart below is 2009. This is the worst year for hotels since the Great Depression. And today we’re trending well below that line and dropping further at the end of 2020.
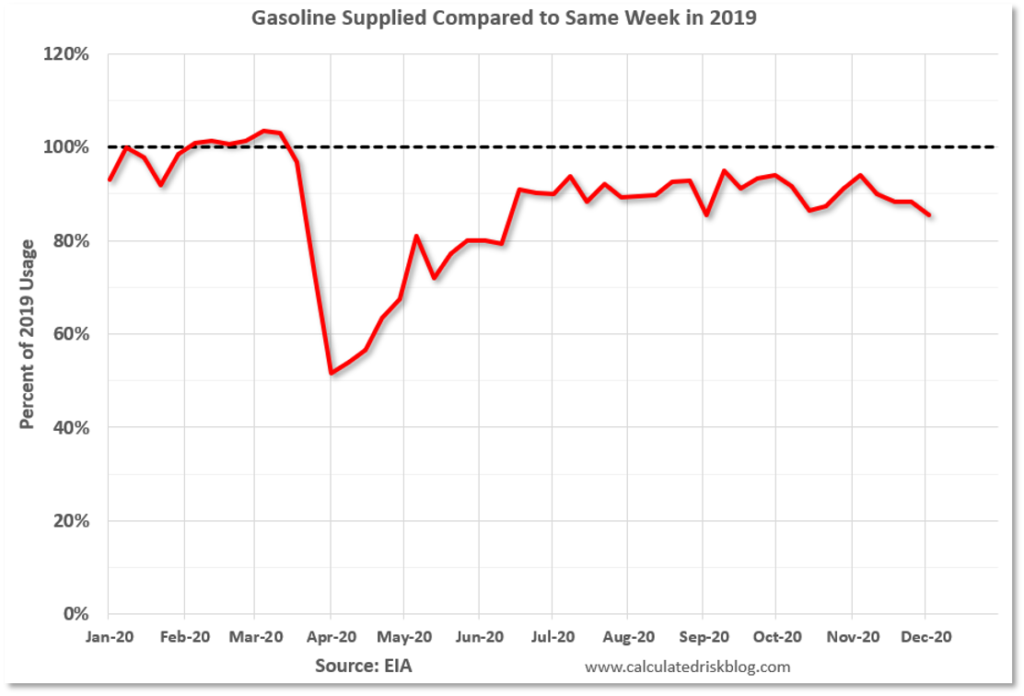
Gasoline consumption is down about 14%, up from a 50% drop in April. It would appear a lot of people are traveling still, but they’re driving instead of flying.
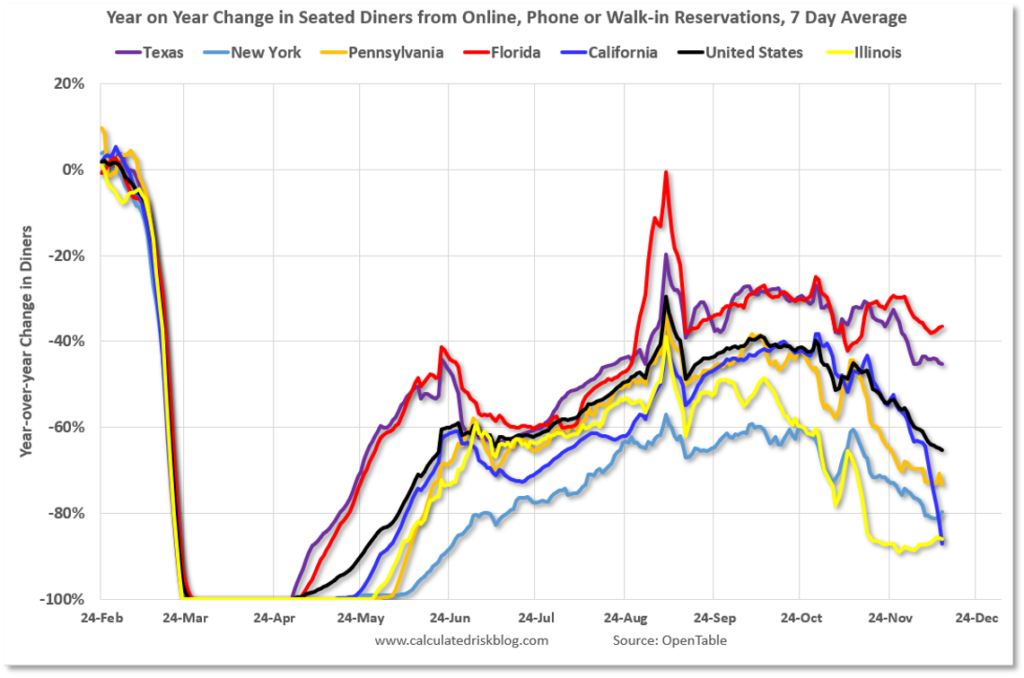
Dining Down – Worse in Colder Cities
According to Opentable, who manages dining reservations, we’re seeing dining down as much as 40% to 90%. Warmer climates are less affected. For example, Florida is down 40%. But in other places like Illinois, New York, we’re seeing dining has dropped as much as 90%. Again, this presents an incredible challenge for these small businesses.
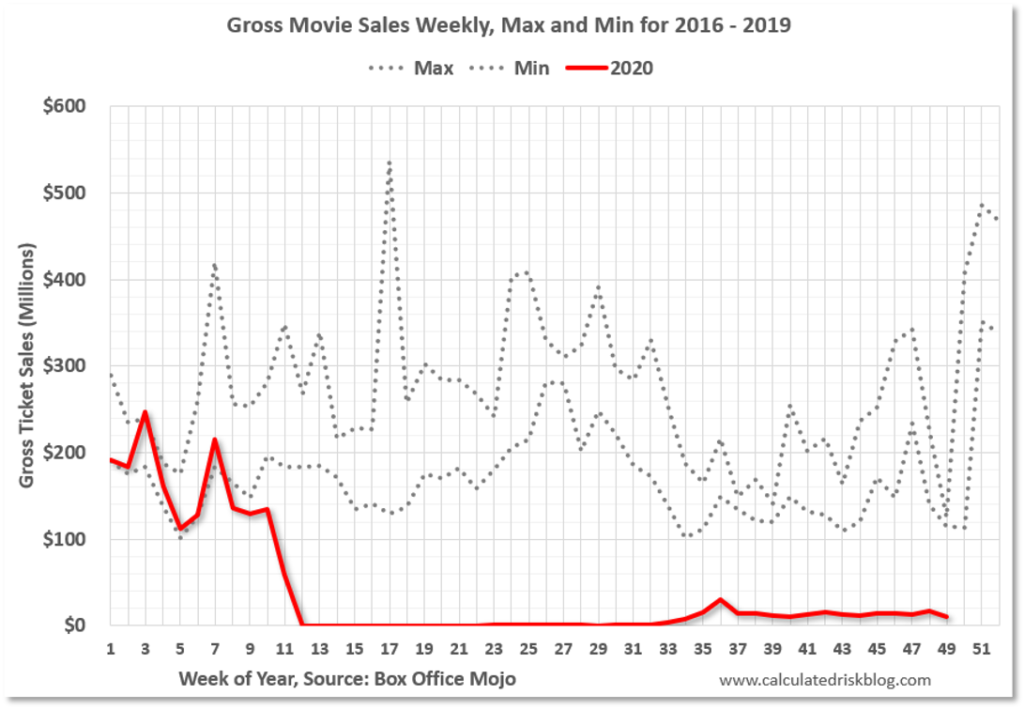
Movies Still Down 90%
Movies are down 90%, according to Box Office Mojo.
Small Businesses Disproportionately Affected
This is data from Harvard University and Brown University showing the percent change in small business revenue. Small businesses are bearing the brunt of the downturn.
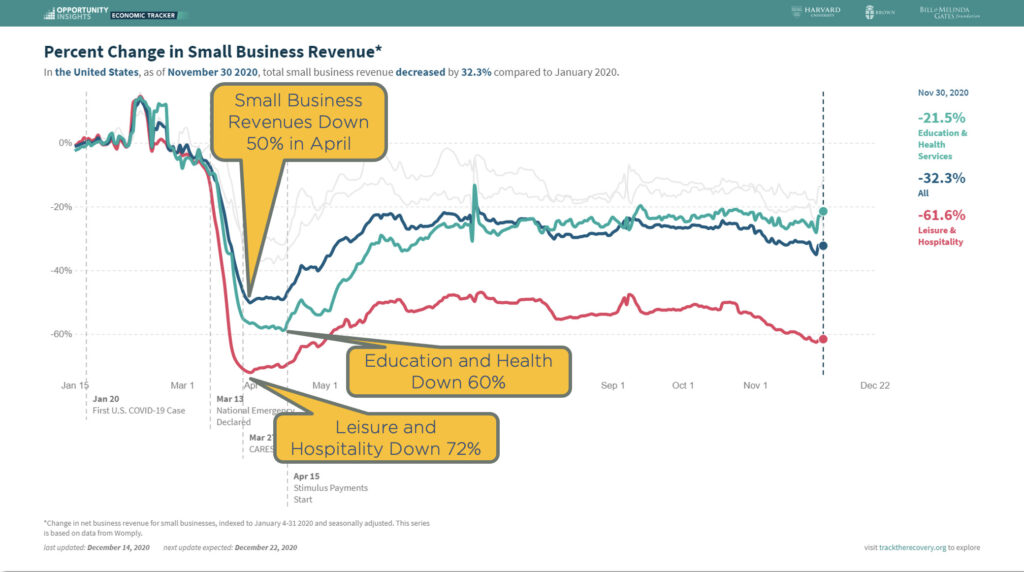
The blue line shows all small business revenue was down 50% in April, though now it is down 32%. Especially hard hit is education and health (teal line), which hit a 60% drop in April, and hospitality & leisure (red line), a 72% drop in the same time frame. The economic impact from COVID has not equally affected all industries, and some are still not doing well.
The next chart shows the number of businesses that have closed throughout the year. In April, at the height of lockdowns, 45% of all small businesses closed. That’s how bad it was. Numbers have improved to where we are now with just 25% of small businesses closed.
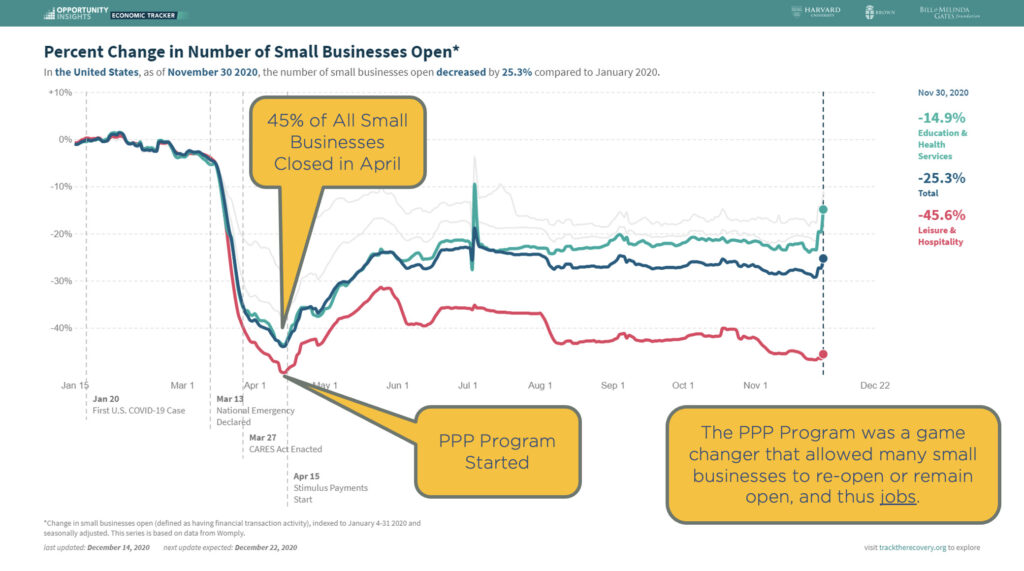
Also in April, at the absolute trough, is when the Payroll Protection Program, or PPP, started. This effort was a direct injection program to help businesses keep their doors open and pay employees. In my opinion, the PPP was an absolute game-changer that allowed many small businesses to remain open or to reopen and thus keep jobs. You can see in the chart the moment the PPP began and the trend reversed from down to up.
Loan Defaults High for Hard-Hit Sectors
Looking at loan defaults, we can see the percentage in special servicing, which is bank vernacular for loss mitigation and debt collection. Twenty-five percent of lodging loans are in debt collection, and 16% of retail loans.
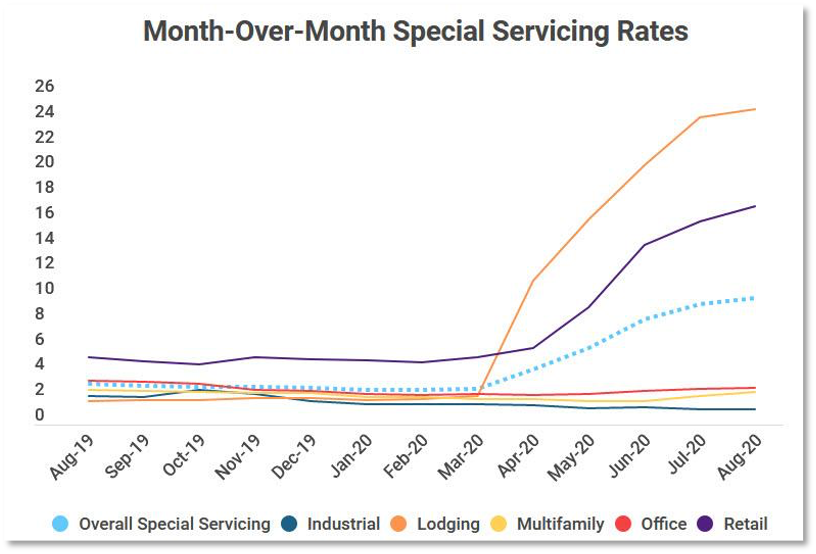
Special servicing rates show the percentage of commercial loans that are in collection. You can see the impact of COVID in March accelerating defaults, especially in lodging and retail.
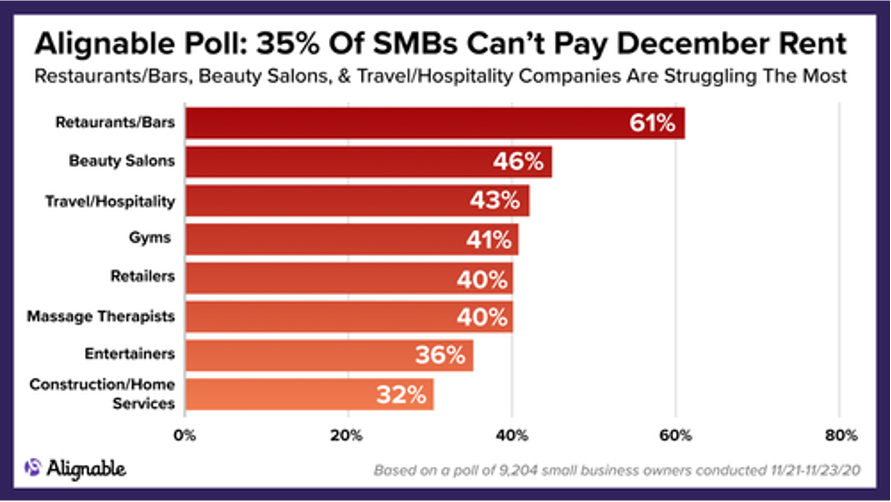
Many small businesses and others in hard-hit sectors are still struggling to recover. Nearly three quarters (74%) of US hotels said they expect to lay off more employees, and two thirds warn they won’t be able to to last another six months. According to Alignable, 35% of small businesses can’t pay December rent. This is why I was excited to see the second round of PPP funding rolling out. These funds are very necessary to bridge us to true recovery.
Is the 2020 Economic Slump Similar to the Great Financial Crisis of 2008?
Many are talking about our current economic scenario being very similar to the great financial crisis of 2008. It’s really not. The 2008 financial crisis was a systemic crisis that substantially impacted the banking system. In 2020, we’re not seeing that.
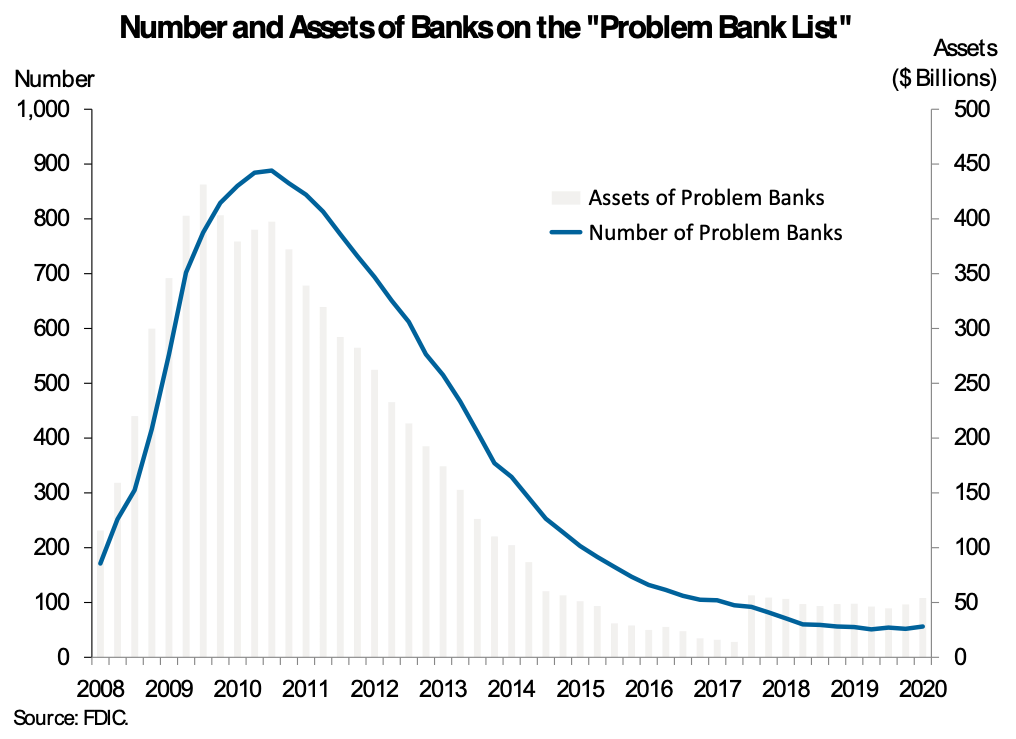
This chart looks at the number of assets on the problem bank list, according to the FDIC. In 2008, we had 900 banks teetering on the brink. Today, we’re at around 50. So COVID’s impact on the economy has not really affected banks. Financial crises explode and spiral when a financial shock becomes a banking shock, because the banks are the financial plumbing of the world.
2nd COVID-19 Relief Bill
The 2nd COVID Relief Bill is a very good solution, in my opinion. The bill includes another PPP round of $284 billion, and $166 billion in direct payments to individuals of $600. The bill also includes more unemployment benefits of $300 per week, which are very critical for the hard-hit sectors.
Without programs like the PPP, businesses will lay off more employees and those jobs will disappear. Once you lose a job, it’s very difficult to get a job back. If you can keep the job somehow, it helps with a quick recovery. The same goes for unemployment benefits – putting a little cash in people’s pockets, allowing them to pay their rent and buy groceries, keeps them from entering into a tailspin where long-term economic injury begins to happen.
In addition, the relief bill includes $25 billion in emergency rental aid, a national eviction moratorium and $82 billion in funding for colleges, transportation etc.
What about the risk of inflation? Will the stimulus plans increase inflation?
One of the things that a lot of people have been predicting is high inflation due to all the stimulus. And it really hasn’t happened. Here are four measures of consumer price inflation.
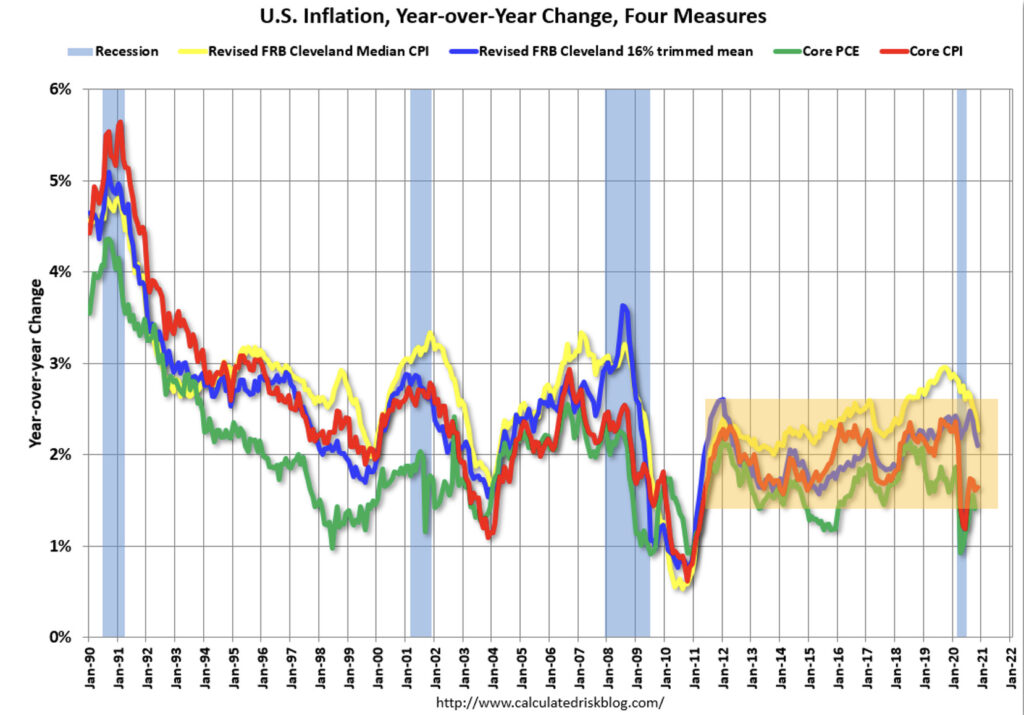
Basically since 2011, we’ve been in the 2% inflation range however you measure it. So in spite of the aggressive money printing, we’ve simply not seen inflation run rampant and there are reasons for that that I’ll cover later in this economic series. We’ll talk about why inflation is low and what the effect of these stimulus programs are long-term.
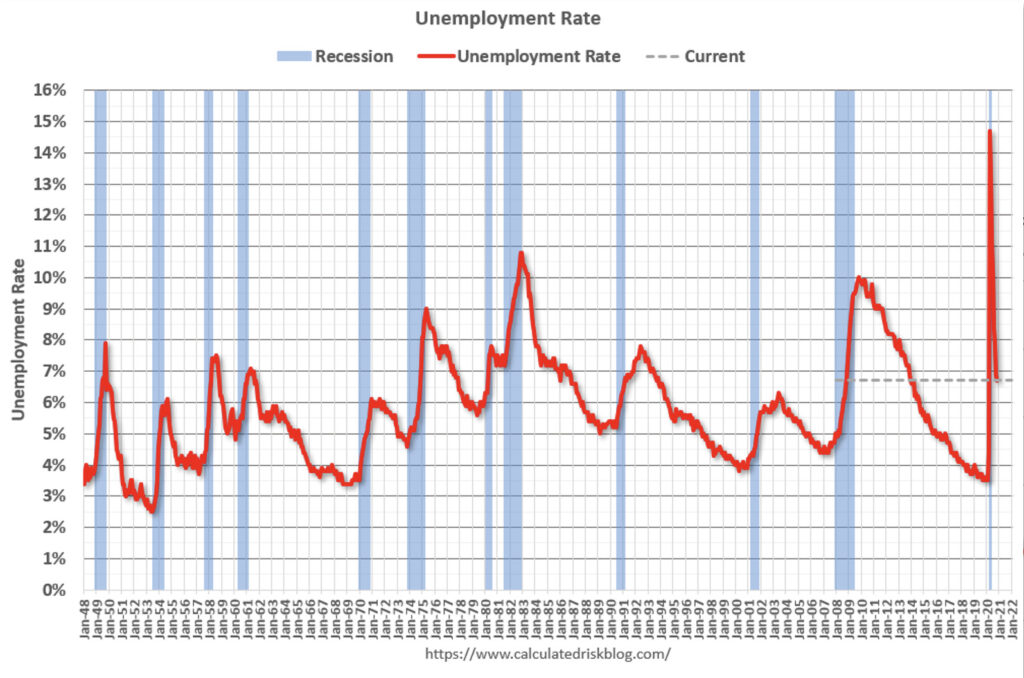
Unemployment Rates Improving
The unemployment rate initially spiked up to about 14.5%, and has now dropped down to 6%. The stimulus programs have been a driving force in reducing unemployment, and as soon as the programs rolled out, they provided relief across the United States, economically speaking. Right now, unemployment rates are still elevated, but improving.
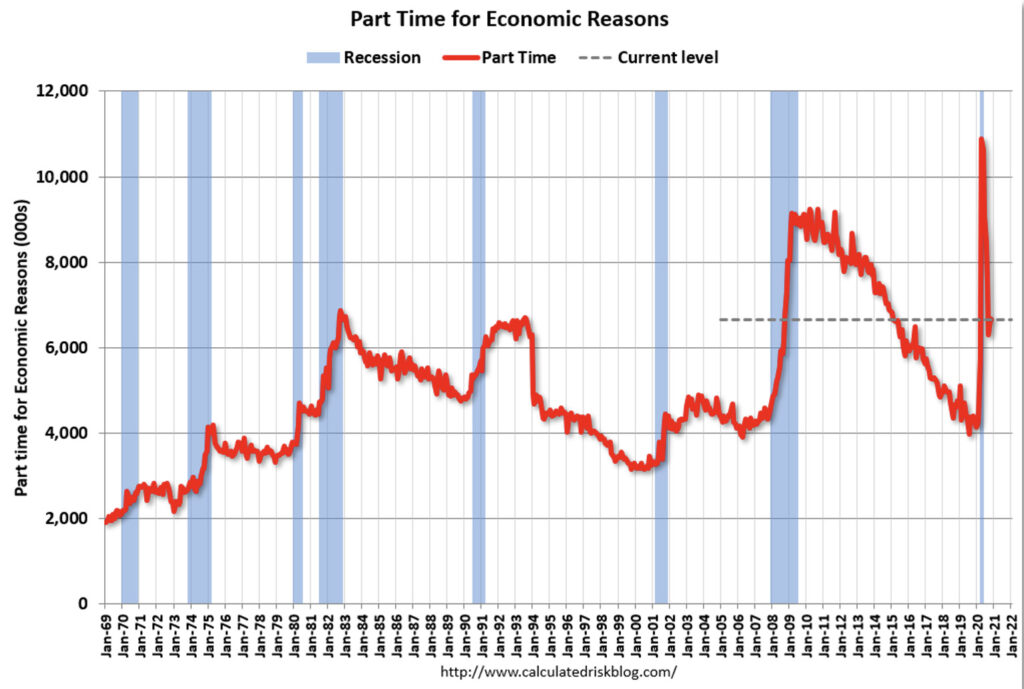
Part-time employment for economic reasons, which is a broader measure of unemployment, also spiked up very high in early 2020, but is now far lower than it was.
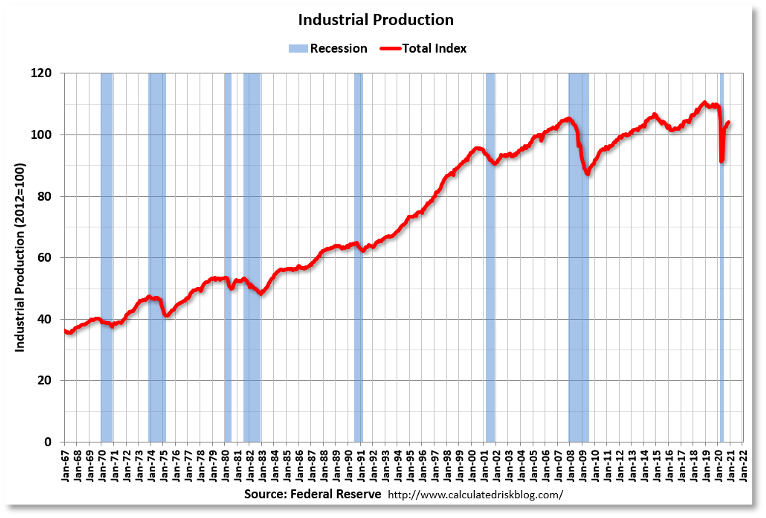
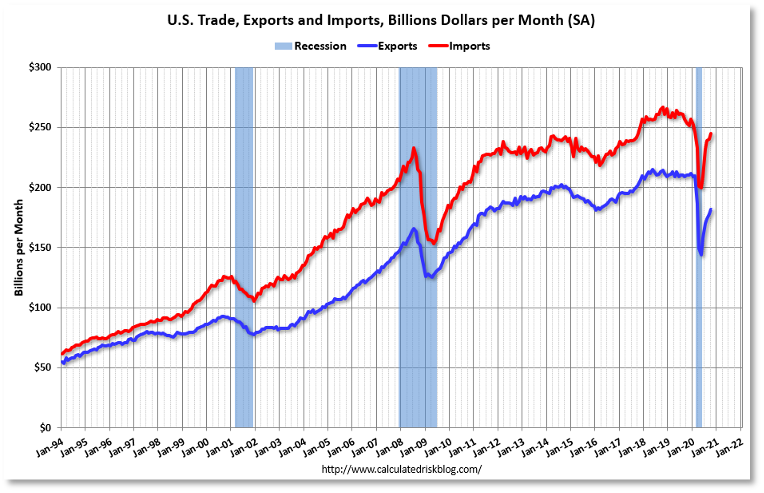
Industrial Production and Trade Steadying
Perhaps a little surprising is the recovery for industrial production and trade. The chart below shows US industrial production since the ’60s. In early 2020 it took a massive dip, very similar to what happened in the ’08 crisis. This time around though, the recovery has been dramatic. Industrial production is up, as well as trade. The trendlines for trade and imports and exports are almost identical. People and businesses adapted and consumption continued. This is much better than I was expecting.
Homeowners are Doing Well
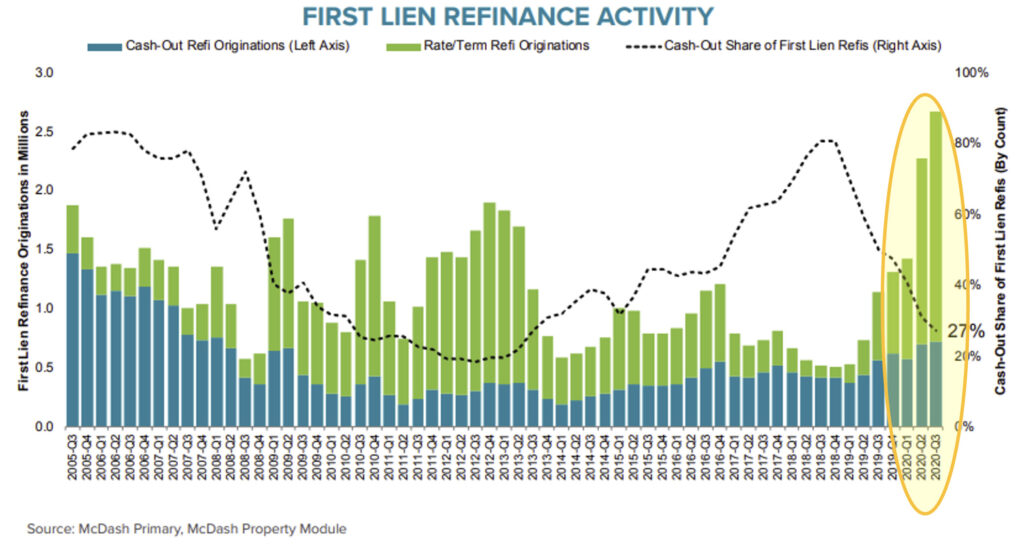
Mortgage Refinances
One surprising reality is that homeowners are doing very well. We’re on pace for 9 million refinances in 2020 – an absolute record. Just about 27% of those refinances are cash-out refis, where homeowners pull money out of their equity. The remainder of the refinances are rate and term refinances. This puts cash in homeowners’ pockets, and improved cash flow.
Household Net Worth Booming
This is a very astonishing graph to many and shows household net worth according to the Federal Reserve.
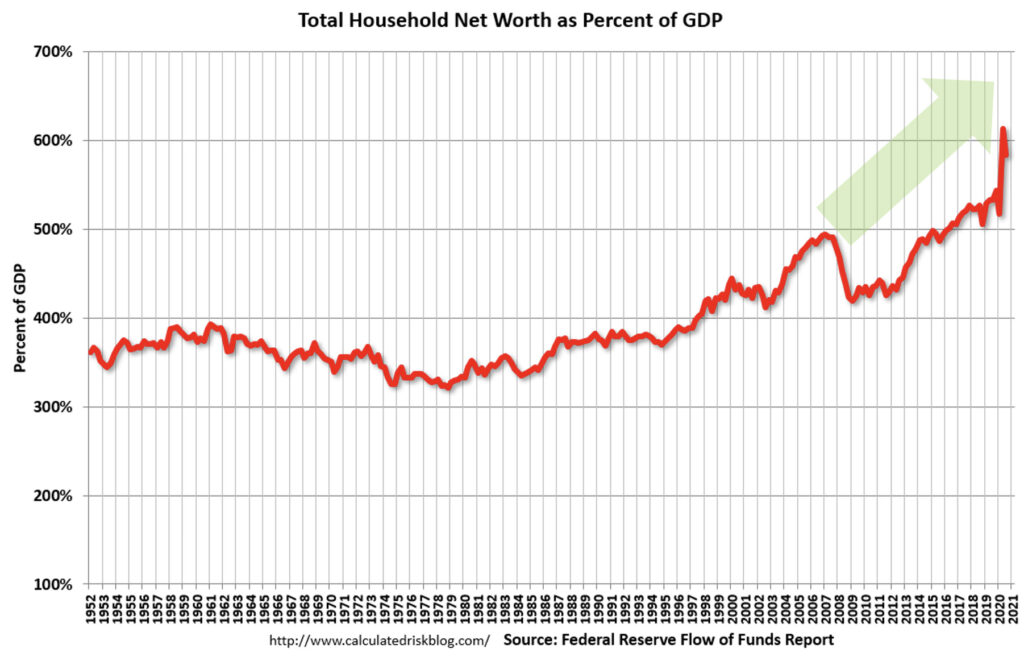
Household net worth is booming. Take a look at what happened in 2020. Household net worth has skyrocketed. The reason for this is two-fold. Household net worth is driven by 1) a strong stock market and 2) housing price gains.
This graph is confounding to many because we’ve also seen so much financial turbulence for so many over the last year. This is because we’re seeing a very bifurcated economy & recovery. For those that own homes and own stocks, they’re seeing growth that’s higher than average.
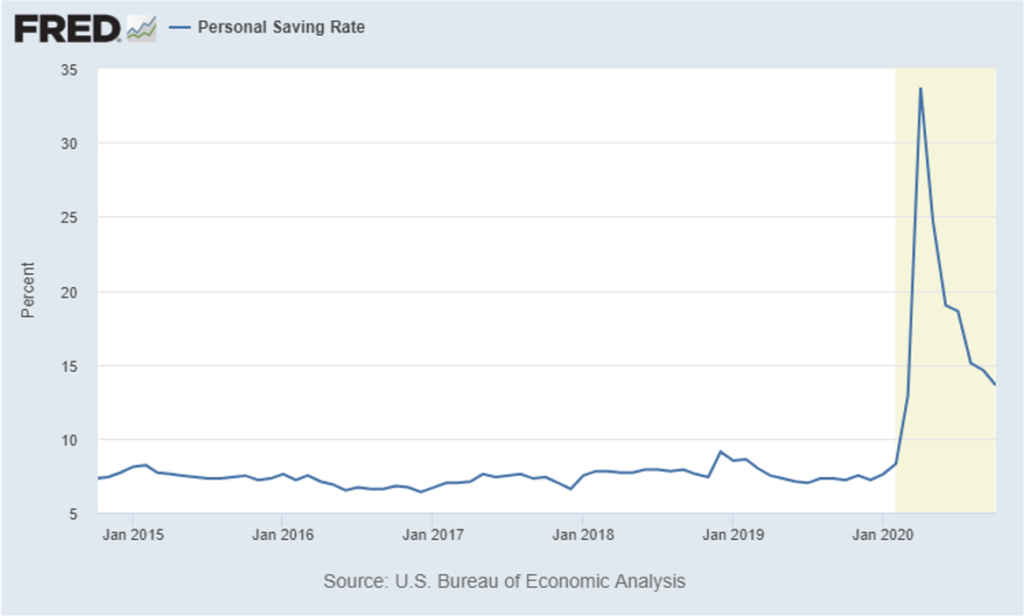
Personal Savings Rate Sky High
Another amazing graph looks at the personal savings rate. The savings rate took off in early 2020 as people stayed home and didn’t travel, didn’t shop, and didn’t go out to eat as much. Guess what they did? They saved. This has also been amplified by the direct stimulus checks.
Consumer & Business Optimism
Consumer and business optimism are important to look at because so much of the economy is actually built on sentiment, or expectation for the future. If you believe that things are going to get better, then you invest and you spend. If you believe that things are getting worse, then you don’t. Economic activity is, in many ways, very dependent upon mindset.
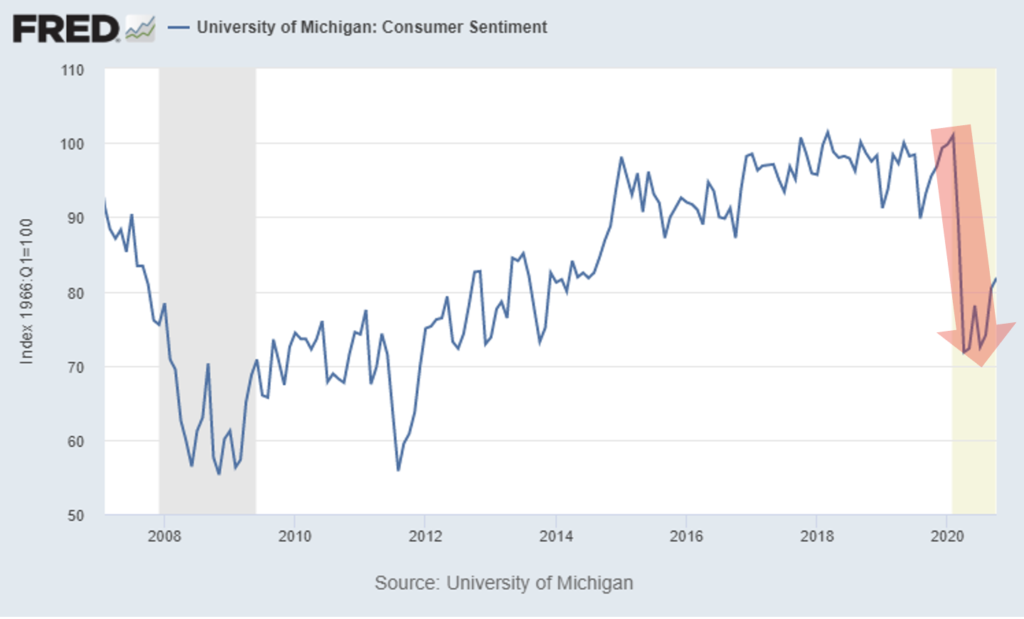
Consumer Sentiment has Dropped
Consumer sentiment is incredibly important because 70% of the economy is driven by consumer spending. If consumers stop spending, we would have an economic crash. You can see in the chart below that what happened during COVID is consumer sentiment just got crushed, but lately it’s ticking up slightly. This drop is clearly not good and there’s still a lot of room for improvement.
Business Sentiment Rapidly Recovering
However, business sentiment is very different. Business sentiment is what drives jobs and investment in capital spending. A confident business is going to hire people and will invest in new technologies, new plants, equipment, etc.
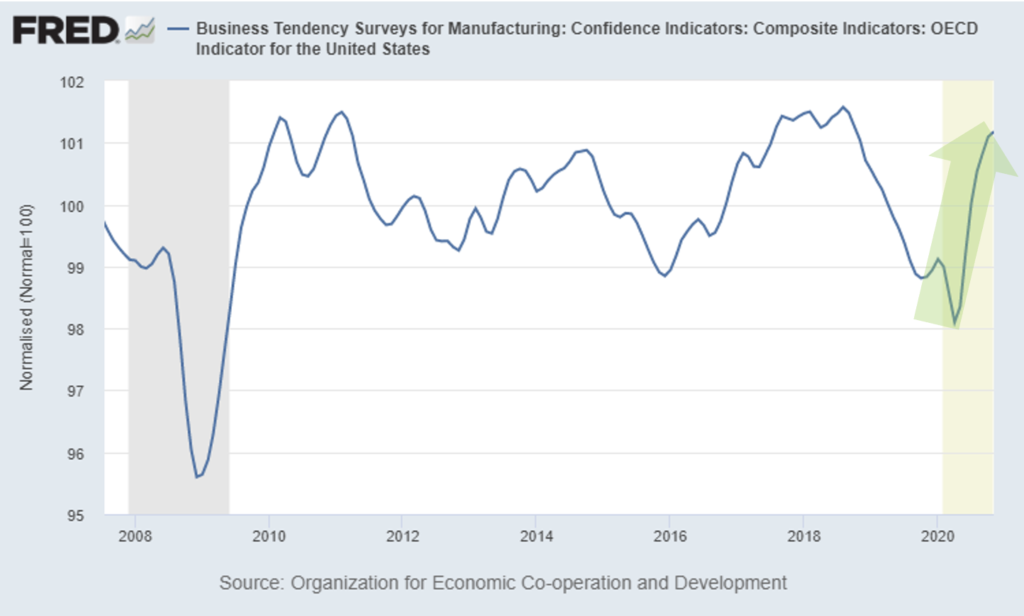
Business sentiment has recovered quite rapidly. And the timing here coincides perfectly with the PPP Program. I believe it wasn’t just the cash injections of the PPP that reversed the downward trend of business sentiment, but the fact that the government acted quickly and was willing to not let businesses spiral out of control. Business owners were reassured that the government had their backs and would not let the economy spiral down to a second Great Depression, which, in my opinion, could have happened.
The Great Depression happened in the ’30s because we had this financial shock in 1929 and the central banks didn’t have the tools at the time to stimulate the economy, let alone the mindset that they could or should. This created a destructive cycle where people lost their jobs, stopped spending. And once people stop spending, business revenues went down, and once business revenues went down, they laid off employees, creating a negative cycle in which the economy basically self-destructs. So the stimulus programs we’ve seen in 2020 are very important to stop that cycle and create a new virtuous cycle where jobs are created, and then those people with jobs now spend, boosting the economy, creating more jobs.
Recap & Next Article
Up to this point, we’ve covered what happened economically in 2020, and have set the stage for where we believe the economy is headed in 2021.
Next article in series: COVID-19 Economic Recovery
About the Author

Mr. Fraser has 20+ years’ experience as a finance and technology executive and is a former E&Y Entrepreneur of the Year Award winner. In 2012 Fraser co-founded Aspen Funds, a fund management company focused on mortgage investments. Fraser is responsible for financial management, portfolio modeling, as well as systems and processes, designing and deploying Aspen’s scalable state-of-the-art back-end platform.