In part 1 of the summer 2021 economic update, we covered inflation and whether it’s something to be worried about. Part 2 will cover real estate and where the housing market is headed.
Current Real Estate Market Overview
Home Prices
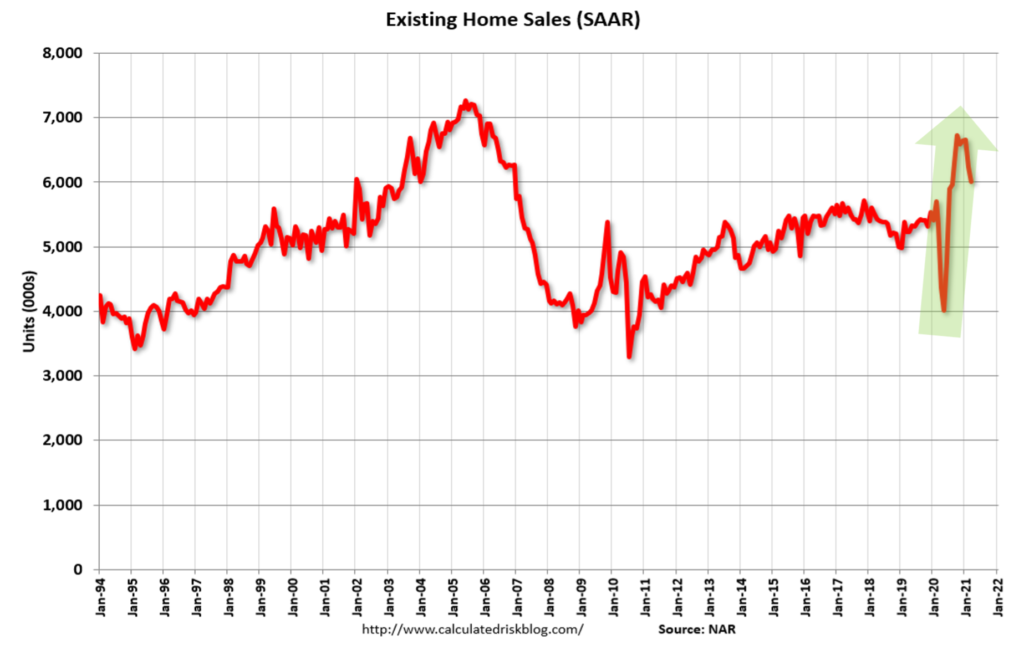
It likely comes as no surprise that home sales are absolutely booming, hitting the highest point in 15 years.
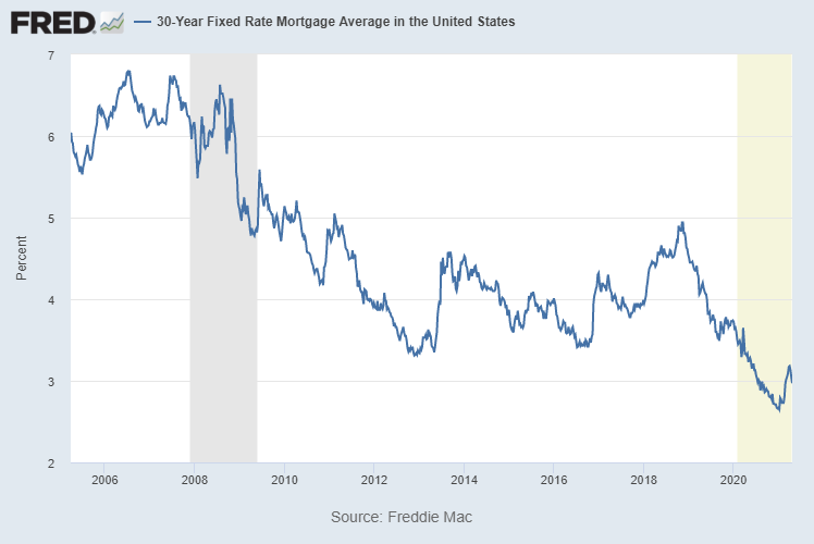
This is in large part due to very low fixed mortgage rates, which you can see in the chart below are some of the lowest we’ve seen in recent years.
If you break housing down by metros, prices are on the rise and are now above the 2006 peak across all metros. Take a look at the chart below. The green trend line is the largest 10 cities in America, the blue line is the largest 20 cities, and the red line is the national average. For all 3 indexes, there was a sharp increase end of last year on top of an already aggressive climb upward.
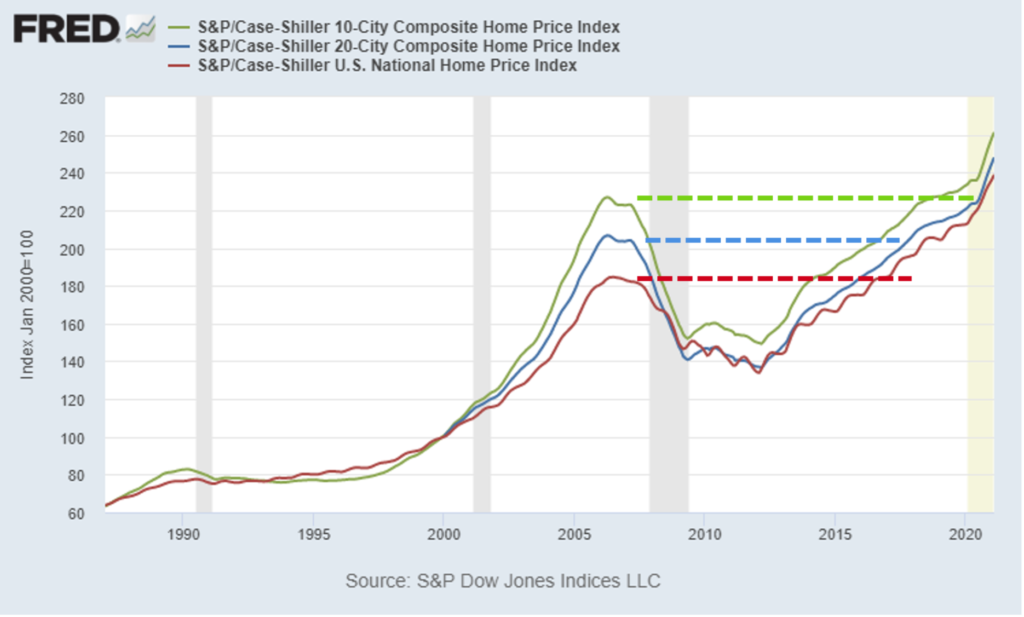
After the 2008 crisis, the national average for home prices recovered ahead of the largest cities’ prices, but now are all well above previous peaks. Some might be concerned looking at the prices and seeing how far past the previous peak we are. But take a look at the chart below where I’ve adjusted the trends for inflation.
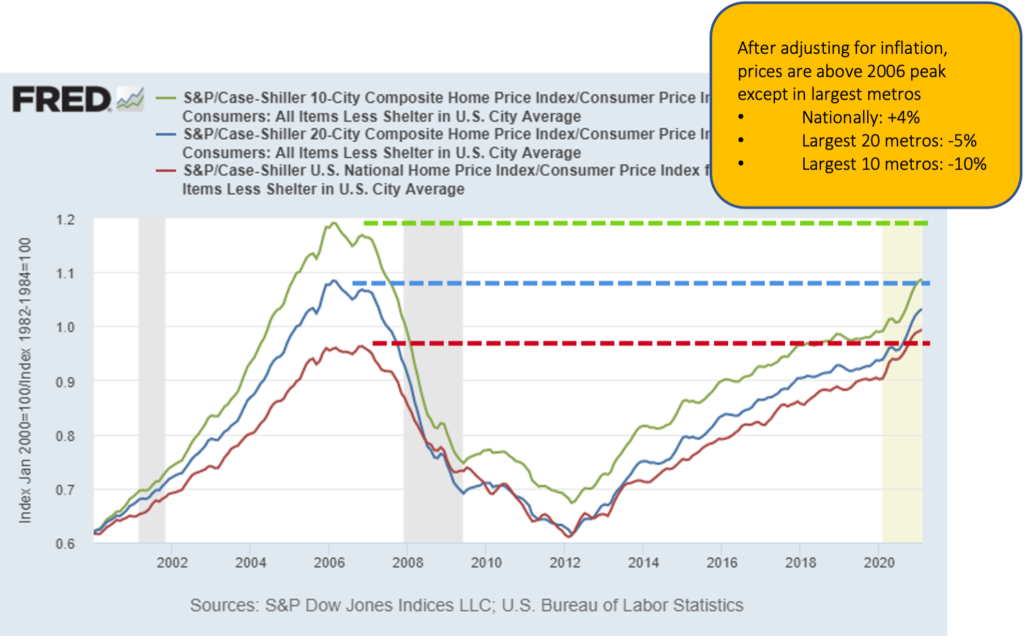
When you adjust for inflation, both the largest 10 and largest 20 metros, are actually still well below their previous peaks. Inflation has been steadily increasing over the last 15 years and home prices are still catching up. Nationally, we have just surpassed the previous peak for the first time.
Though prices are rising, it’s still cheaper to buy a home than to rent in terms of monthly payments. See the chart below.
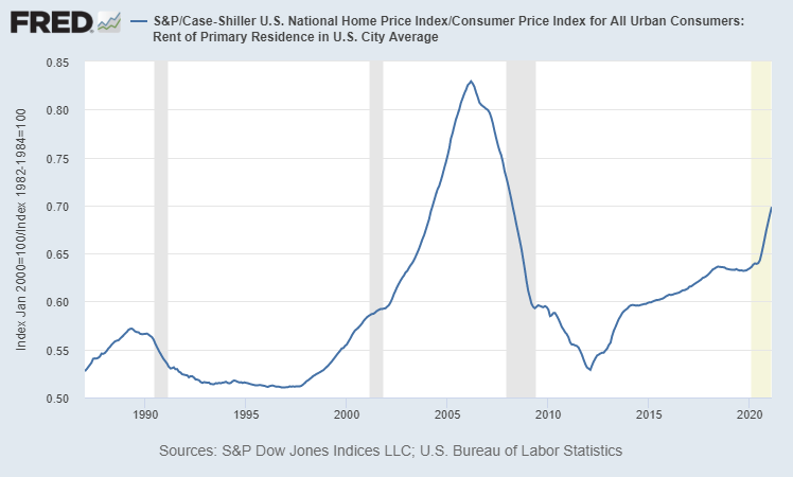
This is due in part to an acute housing supply squeeze, causing more people to continue renting. There is a massive shortage of houses available for purchase, as they’ve been underbuilt for the last 15 years.
Supply Shortage
With the current acute housing supply squeeze, we only have a 3.6 months’ supply of homes available, one of the lowest amounts in the last 25 years.
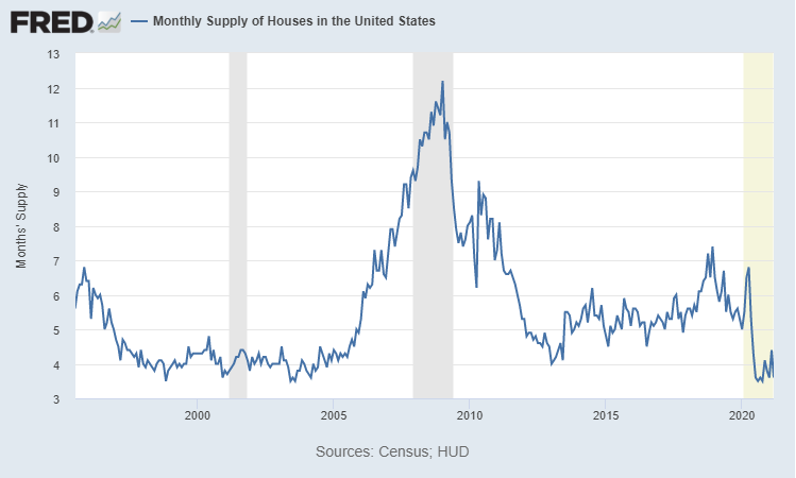
This housing shortage is primarily due to housing being underbuilt for the last 15 years.
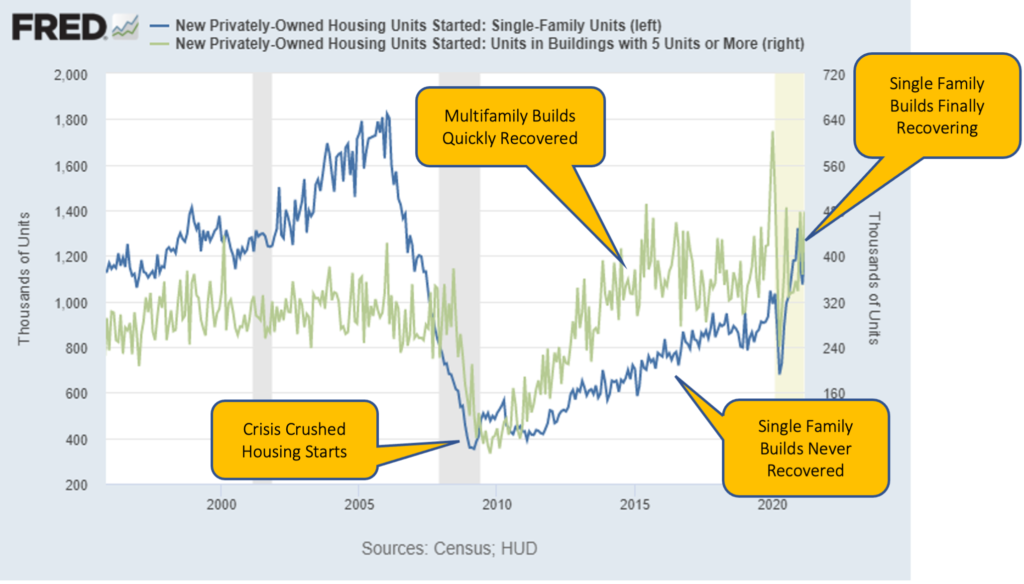
In the great financial crisis in 2008, new single-family construction came to a halt, as you can see from the blue line in the chart above. New multi-family construction, the green line, also dropped, but has since recovered to above pre-2008 levels. Single-family construction, however, has only recently recovered to historical levels.
So why aren’t more houses being built?
Back before the financial crisis, you could buy a plot of land, build a house on it, and sell it for profit. But now if you did that, you may not make money. Why? Because of inflation. Inflation has continued to climb over the last 15 years, and the cost of land, labor and materials has grown significantly. And as we saw in an earlier chart, house prices have not kept pace with inflation, meaning new single-family home builds have generally not been profitable.
But we can also see that single-family construction is starting to pick back up and enter into a normal range. As that blue line continues to tick upwards over the next couple of years, we’ll see a new supply of homes being built that will actually start to normalize the market and take the pressure off.
Chronic Shortage Relative to Population
Taking the data of single-family builds and adjusting it relative to population shows a chronic shortage. During the 15 years since the crisis when no new homes were being built, population kept growing, continuing to widen supply gap.
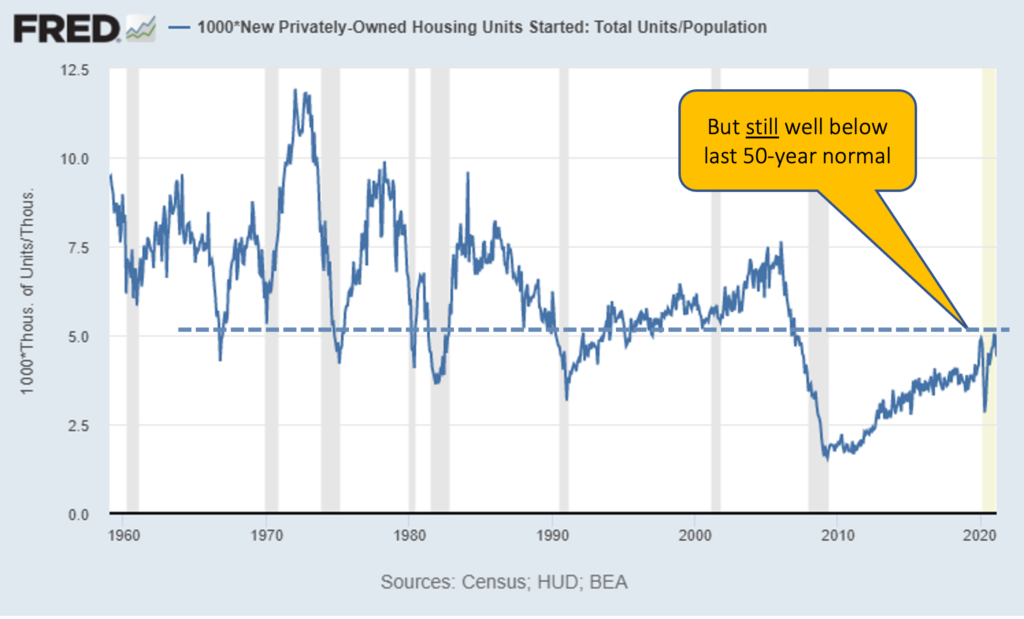
Demand continues to climb as the population increases. Once the number of builds starts to normalize and catch up on this shortage, I’ll call a top to the housing market, but we’re still not that close to that point.
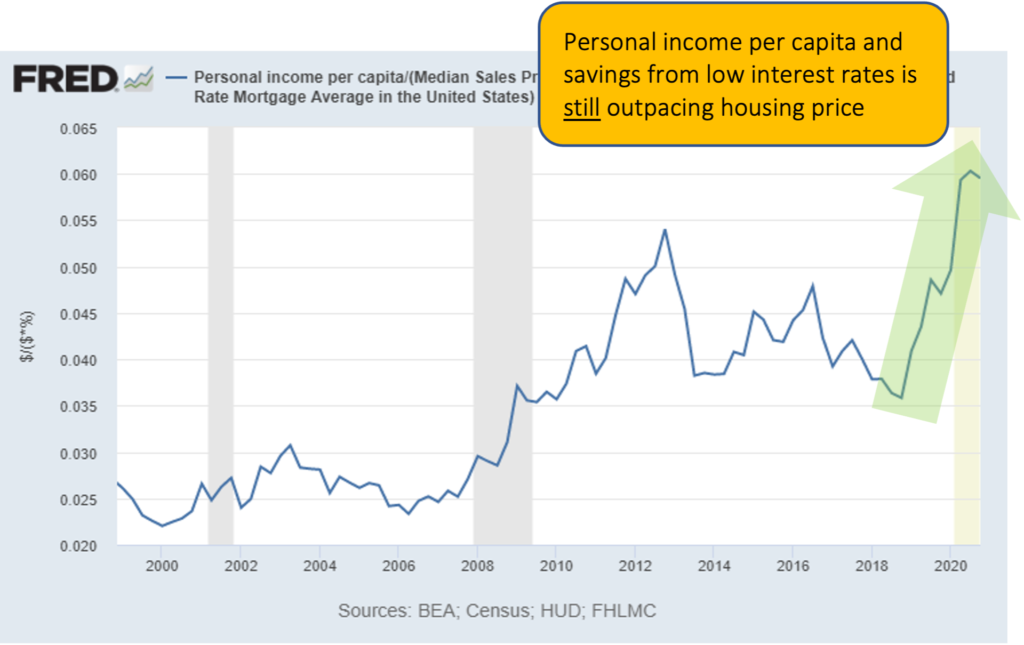
This also speaks to housing affordability. Even with higher home prices, the rising income per capita and higher savings from low interest rates are still out-pacing housing price growth. It’s still affordable to buy homes relative to income.
So are we in a bubble?
Mortgage Loans Then vs Now
Because there is real, pent-up demand for housing after a 15-year shortage, we are not in a housing bubble. Take a look at this data from CoreLogic showing the differences in home loans from the early 2000s compared to now.
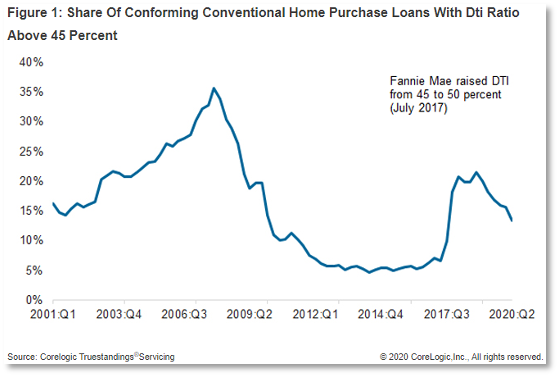
The line shows the percent of home loans where the debt-to-income (DTI) ratio is above 45%, meaning where almost half (or more) of a person’s income is going towards paying for the roof over their head. In 2006, that was over a third of the loans. To a banker, the lower this number the better, as it means the mortgage is more affordable relative to their income.
Right now, we’re not even close to that. DTIs are very conservative.
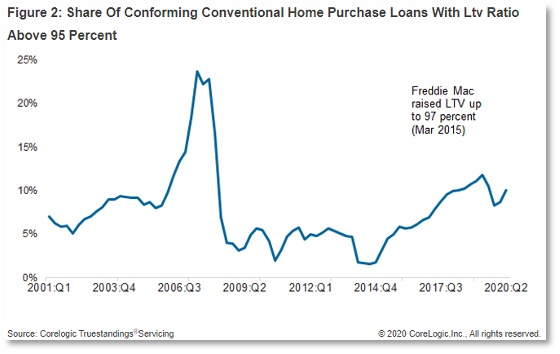
The chart below looks at loan-to-value (LTV) ratios above 95%, meaning a buyer has only 5% equity in a home and the rest of the purchase price is supplied by a loan. In 2006, more than 20% of homes were purchased with an LTV over 95%. Today, we’re less than half of that.
And take a look at this chart showing the percent of mortgages that were low doc/no doc loans. A loan of this type is basically one where there is little or no income verification. A buyer could simply state how much they earned and no one would double check.
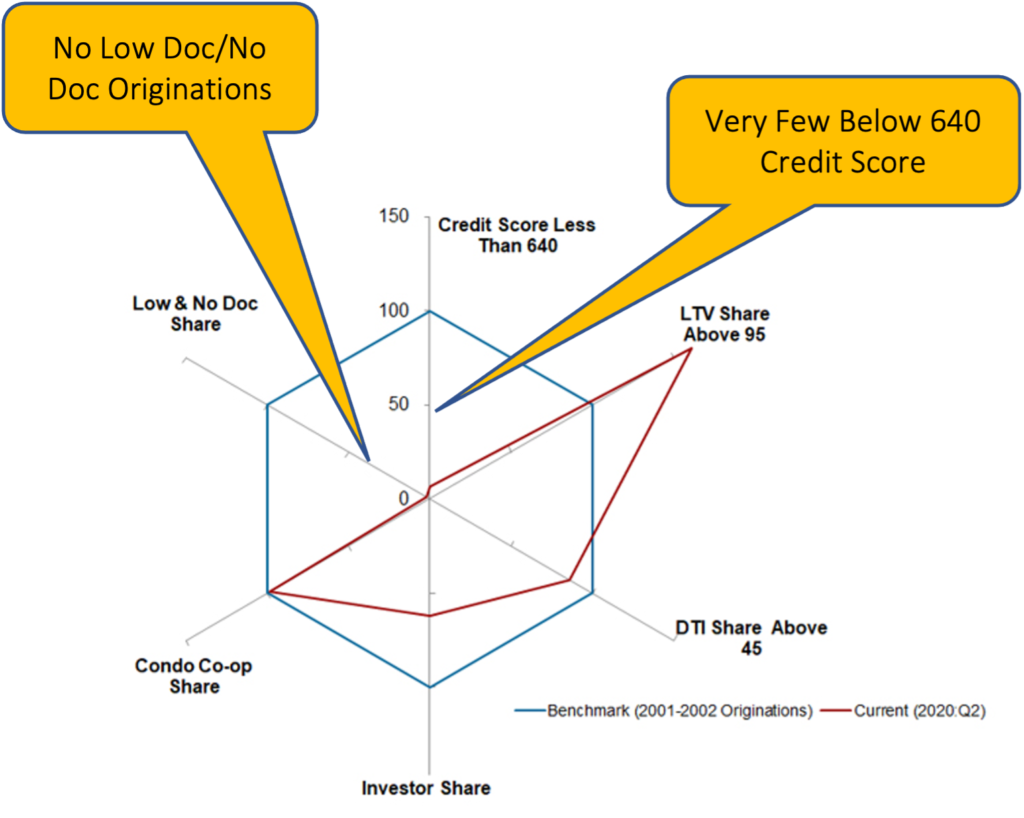
These low doc/no doc loans that were so popular in 2006 during the housing bubble are almost non-existent now. Same with loans for buyers with credit scores below 640, another large share of loans originated in the mid-2000s. The underwriting on mortgages now is much more conservative.
Real Estate Bottom Line
- Homes – Record Strength to Continue
- Corelogic forecasting +1.9% growth in 2021
- Zillow forecasting 10-12%
- Our estimate: growth will be at or above 2020 levels: 8-10% growth in 2021
- Few new homes being built
- Low housing supply: 3.6 months
- Low Interest Rates
- High Affordability
- Low Price to Rent Ratios
- CRE Multifamily and Office – Global interest rate compression will keep cap rates low
- Office demand will significantly soften as work-from-home becomes permanent for many. But since most office space is on long-term leases, impact will not be immediate or acute
- Retail & Lodging – Huge opportunity in distressed properties
Additional Reading
Passive Real Estate Investing Complete Guide for 2021

Mr. Fraser has 20+ years’ experience as a finance and technology executive and is a former E&Y Entrepreneur of the Year Award winner. In 2012 Fraser co-founded Aspen Funds, a fund management company focused on mortgage investments. Fraser is responsible for financial management, portfolio modeling, as well as systems and processes, designing and deploying Aspen’s scalable state-of-the-art back-end platform.