Note: We have a more recent economic forecast for 2021 that can be found here.
In the last two sections of our economic analysis, we covered several of the key fundamental drivers of the economy and the direction of these “tides.” If you missed either of the last two articles, you can read them here:
In Part 3 of our series, we are shifting our focus from the U.S. Economy and looking at the stock market and valuation metrics.
Let’s dive in.
The Stock Market & Valuation
As we’ve discussed earlier, it is important to differentiate between the stock market and the economy, as they can sometimes be used interchangeably. Now that we’ve evaluated the data on the fundamentals of the economy, we will spend some time looking at the stock market.
The stock market has had an incredible run over the last decade. However, many investors are becoming increasingly nervous, and are questioning whether it can continue going up.
Market Valuation Metrics
You may have heard the term “value investing.” This subset of investing philosophy has been popularized by famous investors such as Warren Buffett – and for good reason – Buffett is the most successful investor in history. And simply, the philosophy espouses that the price you pay for an investment is just as important as the investment itself. For example, Amazon is a great company, but is it worth the price of its stock?
Price to Earnings Ratio
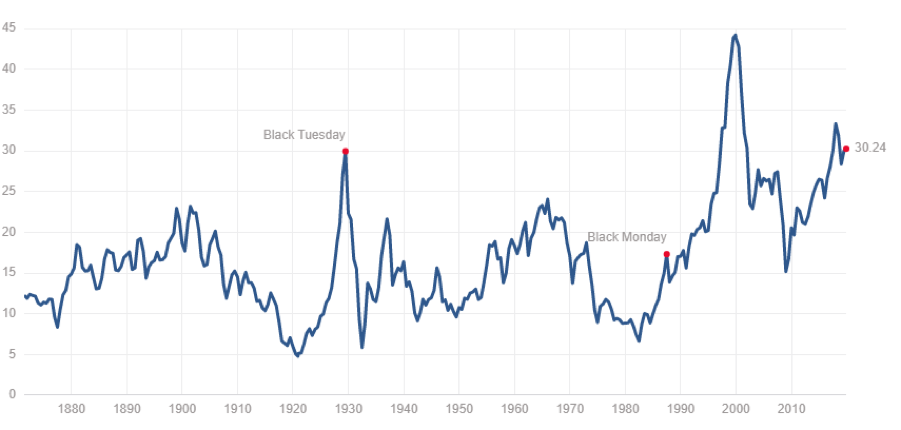
A simple measure of valuation is the P/E ratio (price to earnings ratio). This is the price of a given stock divided by the earnings of that company. Collectively, for the S&P 500, as of the time of this writing, the P/E ratio is 30x. That means effectively, a business that earns $1,000 per year would be valued at $30,000. Would you pay $30,000 for a business that puts $83/month ($1,000/year) in your pocket? In essence, that is what you are doing if you are buying the stock market right now. This ratio changes over time and, as you can see in the chart below, generally is higher before market corrections or recessions (though not always the case). At a 30x P/E ratio, the valuation of the stock market is historically expensive.
And many companies have a much higher P/E ratio, like Amazon, which is currently over 70x. Value investing is not the only way to make money in the stock market, but it is probably the most respected. And value investors are shunning this market. Buffett said in his most recent annual letter, “Prices are sky-high for businesses possessing decent long-term prospects.”
And it makes sense — the more you to pay for an investment, the less you are likely to profit. And in the mid-long term that is generally the case.
Modern money management theory has purported the idea that it’s always a good idea to be invested in the stock market, because, “over the long run, the stock market goes up.” Well, as you will see, that is not always true. Valuation has a large part to play in this and has been a great predictor of future stock market returns.
The Single Most Important Chart for Stock Market Investing
Historically, when P/E ratios were lower, it was a good time to buy stocks, and when P/E ratios were higher, it was a good time to sell stocks. We’ve put together a chart to display this relationship between valuation and future returns. As you can see in the chart below, there is a clear negative correlation between them. And again, it makes intuitive sense that the more you have to pay for something, the lower your future returns will be. Contrary to what your money manager says, you should not always be in the stock market.
This chart plots the actual historical P/E ratios over the last 60+ years relative to the subsequent 10-year annualized return. Each dot represents a monthly data point – the actual P/E ratio on the first of the month, and actual annual return you would have received over the next 10 years had you invested on that day. As you can see, there is a clear negative correlation – the higher the P/E ratio, the lower the annual returns. So, for example, when the P/E ratio was low (around 10x), over the following 10 years, the stock market return was 10% on average. But, when the P/E ratio was high, like during the internet boom in the late 90s when it was in the 40s, you would’ve earned -3% (i.e., lost money) over the next 10 years on average.
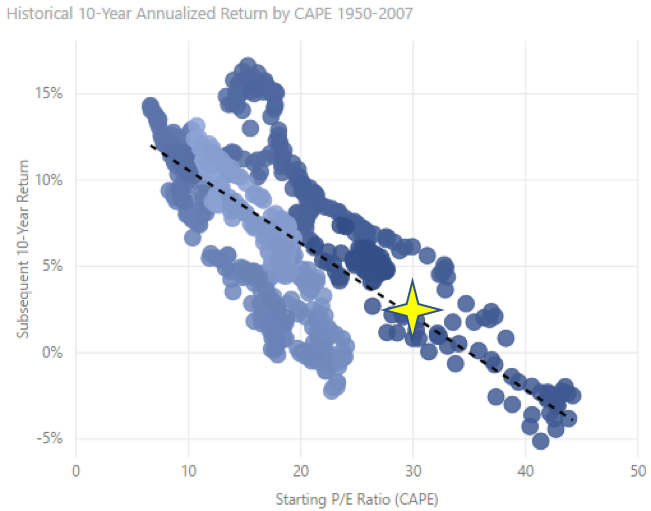
So where are we now, you are probably asking? With a current P/E ratio hovering around 30x, we are at the high end of the historical range. And if history is any predictor, you can expect the next 10 years’ annualized returns to be less than 5% (and Morgan Stanley agrees with us — see Don’t celebrate the Dow record too much, Morgan Stanley predicts dismal returns the next decade.)
Warren Buffett’s Favorite Investment Indicator
Another valuation metric that is commonly used is the total Market Capitalization to GDP ratio. Very simply, this measures the total value of all publicly traded companies relative to the GDP, or the value of all goods and services produced annually. It is in essence the ratio of the stock market relative to the economy. This is one of Warren Buffett’s favorite ratios, who has stated, that it’s “probably the best single measure of where valuations stand at any given moment.” It gives a relative historical trend for valuations of the stock market. If you compare this chart to the historical P/E chart, you can see how similar they are.
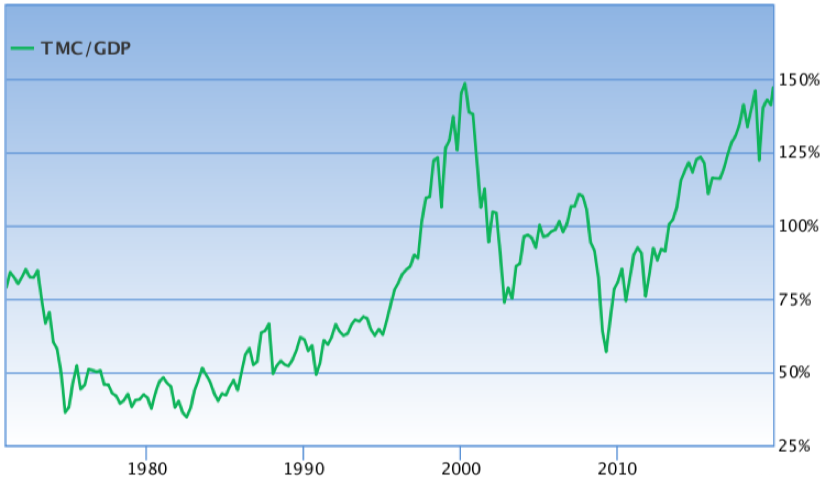
Buffett, who is one of the most famous value investors, continues to hoard the cash of his company, Berkshire Hathaway. As of the writing, his total cash exceeds $120 billion and has been steadily growing. The primary reason for this has been Buffett’s opinion on prices being too high.
Don’t Short this Stock Market
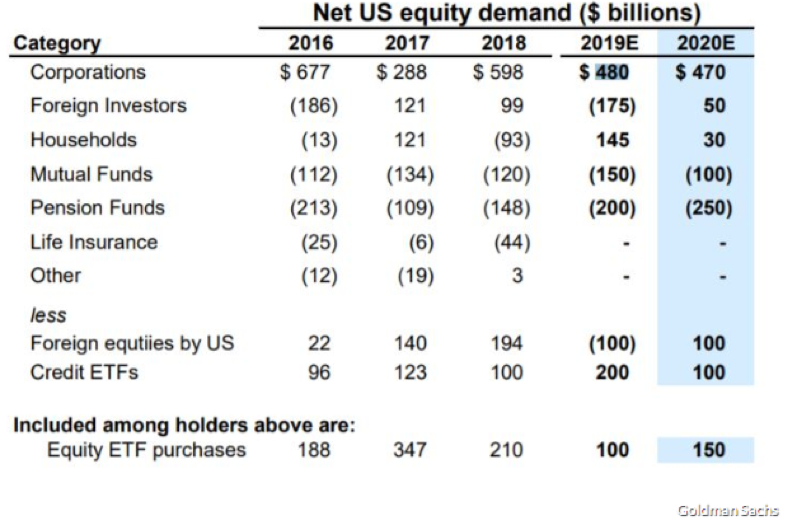
But, before you decide the market is overheated and it’s time to short the stock market (shorting is investing to make money when the market drops), it’s important to look at one of the key drivers of equity demand. As you can see in the chart below, the largest purchaser of equities over the last several years have been corporations through stock buyback programs. This is when companies spend their profits to buy their own stock. And buybacks are expected to remain high in 2020. Repurchasing shares can increase corporation’s earnings per share (EPS), as it reduces the number shares outstanding. Corporations are largely price insensitive buyers, so it isn’t wise to bet against them.
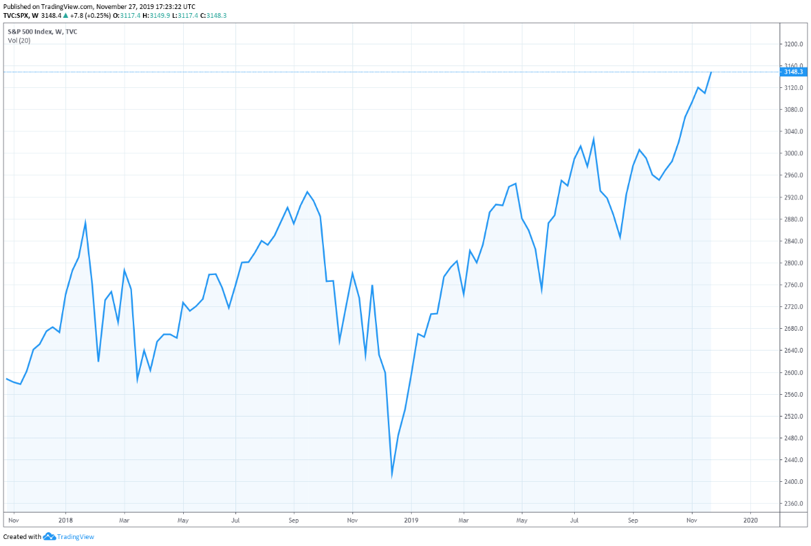
The other reason not to short this market is the 800-pound gorilla sitting in the corner – the Federal Reserve. At any time, they could decide to prop up the market by lowering rates or restarting their bond purchasing program, flooding the system with cash. And while we don’t see a lot of immediate downside in the stock market given the strong fundamentals of the economy, there also is limited upside, due to the high valuation and moderate economic growth. Two years ago, our economics team predicted the stock market would have an upside bias, but with a lot of volatility. As you can see below, this has proven to be true – the drawdowns have been sharp and frequent, but the upside bias is clear. Today our forecast for the next year remains the same: high volatility, but with an upside bias.
Volatility – Why Does it Matter?
This is an aside, but an important concept to understand. Though the stock market has had an upside bias, many investors don’t realize how volatility negatively impacts actual returns. Some may say that volatility is not a concern if you are a long-term investor, and despite the ups and downs of the stock market, over the long-term you’ll come out ahead. But what they don’t understand is that volatility kills compounding. Here’s a scenario that might change your mind.
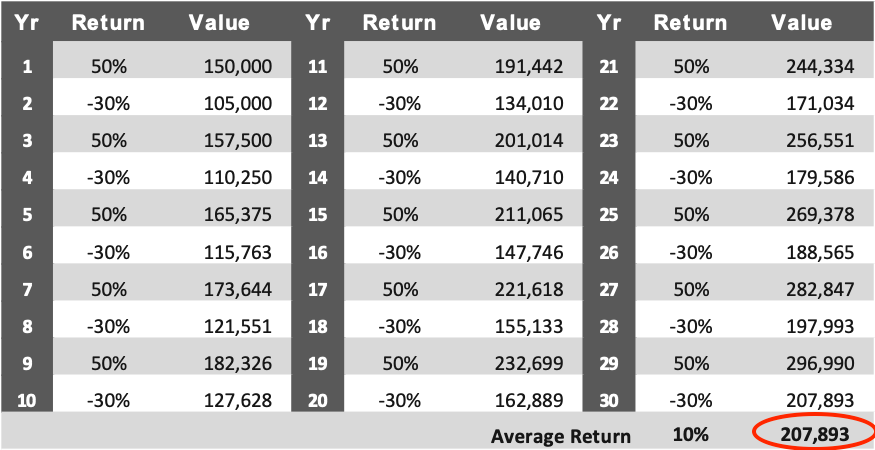
Below, are two scenarios where you initially invest $100,000 and let it grow over 30 years.
- In Scenario #1, you invest the $100,000 in the stock market. You have big gains, but also big losses (i.e. volatility). But, your “average” return over 30 years is 10%. Not too bad, right?
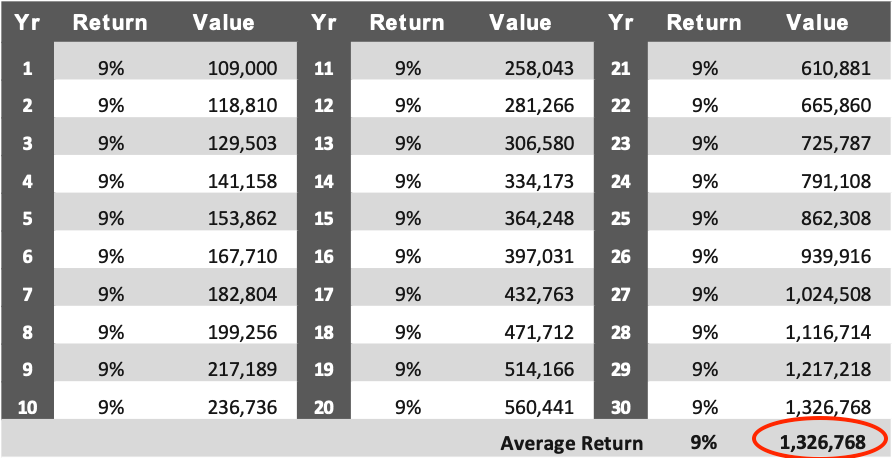
- In Scenario #2 you earn a boring, stable 9% return per year, every year.
Albert Einstein is purported to have said, “Compound interest is the eighth wonder of the world.” You can see below in Scenario #2 the incredible power of consistent compounding. Look at Scenario #2 below. A consistent, stable 9% return turned $100,000 into $1.3 million in 30 years.
Now look at Scenario #1. The average return is higher: 10% vs. 9%. You would expect the returns to be proportionally higher. But in this example, our investor yields are volatile – high then low year to year. Even though the average yield is higher, the overall return is six times lower. Volatility is kryptonite against the superpower of compounding.
What We Would Recommend
The fear surrounding the Coronavirus perfectly illustrates the volatility of the stock market, as we have witnessed large price drops. We expect more volatility throughout the year. Our recommendation for your holdings in the stock market is to remain long or reallocate. Again, we don’t advise shorting the market at this point, as there is still strong equity demand from corporations. But, given the valuation metrics, we expect continued volatility in 2020. Now is a good time to take some of your gains from the market and reallocate into alternative asset classes.
If you are new to private alternative investments, we have resources on our website, including this article on several benefits of alternative investments.
What’s Next?
Thanks for reading our perspectives on the economy and the stock market. The final two sections of our economic analysis will cover a hot topic many investors have been about: the inverted yield curve. And finally, we’ll end our series with a look at the housing market.
Please feel free to share this with any investors you think would benefit.
If you want to make sure you don’t miss the rest of this series, sign up to receive updates and we’ll email it to you directly.
Related Posts:
- 2020 Economic Forecast – Part 1 of 5 – US Economy Part 1
- 2020 Economic Forecast – Part 2 of 5 – US Economy Part 2
- 2020 Economic Forecast – Part 4 of 5 – The Inverted Yield Curve

Ben Fraser is the Managing Director and Chief Investment Office of Aspen Funds. Prior to Aspen, Mr. Fraser was a commercial lender at First Business Bank specializing in government backed loan originations (SBA & USDA), for one of the top SBA lenders in the nation. Prior to that he was a commercial credit underwriter for Crossfirst Bank, personally responsible for underwriting over $125MM in C&I and CRE loans across a variety of industries.