Part 4 of our series on economic predictions in 2021 will cover real estate, including trends in urban flight, single family housing, mortgage delinquencies, housing prices, and details on whether or not there’s a housing bubble.
Economic Tides vs Waves
One of the things I realized decades ago, was that when the tides come in, all boats float. Even boats that have holes in them, boats that are not that great, all boats float. So if you invest in the wrong house, but you did it the right time, you’re still going to make money. And on the other side of the coin, if you invested in the right house at the wrong time, you’re still going to lose money. So when the tides go out, it doesn’t matter how good your boat is, it’s going down. This is why we focus on really understanding economic tides, what the major forces are driving value and asset prices in our day. So let’s dive in here and take a look at the real estate market.
Trends in the Housing Market
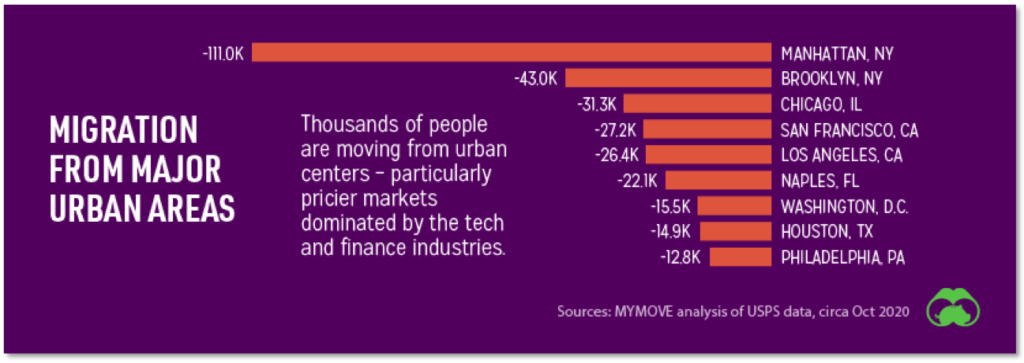
Urban Flight
One new trend we’re seeing is urban flight. People are moving from urban centers, especially in pricier markets. According to MYMOVE, in 2020 111,000 people have exited Manhattan. Another 43,000 have left San Francisco. We’re seeing an exodus from higher cost urban areas, with many people thinking that if they can work from home, why not move? Why work in a crowded, expensive, low-quality-of-life area, when they can live somewhere else that may be more appealing.
Most People Made Full or Partial Rent Payments in 2020
According to the National Multifamily Housing Council, when it came to apartment rents, 76.4% of households made full or partial payments in September 2020, versus 82% a year ago. So we’re definitely seeing some pressure on renters, but it’s not extreme yet. The direct stimulus payments, unemployment checks, and the PPP programs all aided renters.
Where Are Housing Prices Headed in 2021?
Another amazing trend, and something that we have been tracking and forecasting for years, is a super strong single family housing market. We’re continuing an eight year trend of 5%+ year-over-year growth.
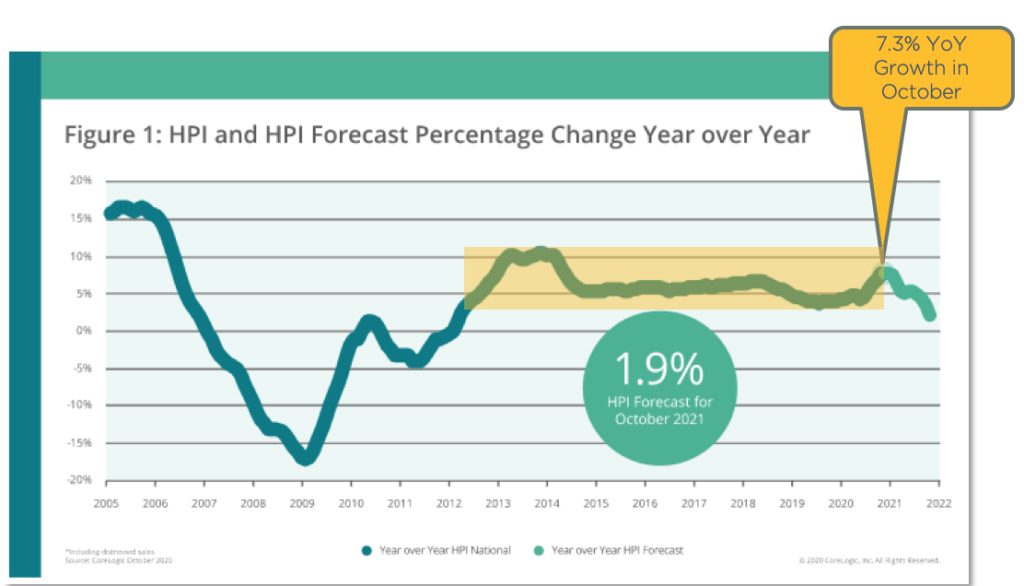
This chart shows home price growth, and you can see we were at the zero line in 2012. But since 2012, we’ve had roughly 5% annual home price growth across the US. As of October, 2020, average homes in the United States rose 7.3% year over year. The real estate market is smoking hot. We have been forecasting this for years, and I’ll tell you in a moment what’s going on and why.
Mortgage Delinquencies Well Below Great Financial Crisis Peak
According to Black Knight who tracks mortgages, mortgage delinquencies are right now at about 6.44%. During the great financial crisis, they hit almost 11%. But of the 6.44%, only 0.33% of those are in foreclosure, well below the great financial crisis peak, but certainly concerning.
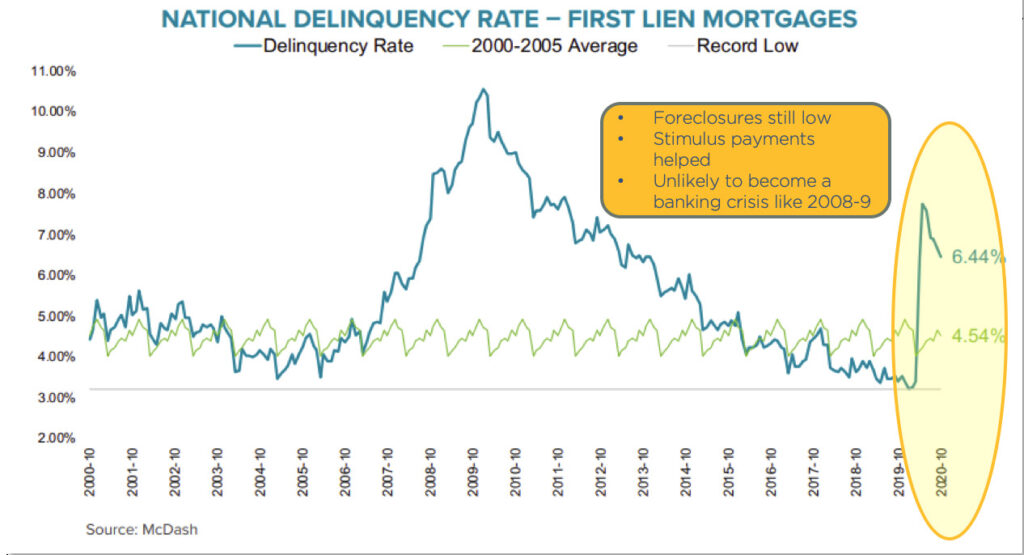
Foreclosures are still low, helped by the stimulus payments, and thus this is unlikely to become a banking crisis like what happened in 2008 and 2009. I’ll also dive deeper into this below.
5.3% of Mortgages In COVID Forbearance Plans
According to Black Knight, 5.3% of mortgages are in COVID-19 forbearance plans, reducing or suspending rent payments for renters. You can see it spiked up in May and has been dropping off.
Fannie Mae/Freddie Mac are required to forebear and there’s really no qualification necessary. So if a renter were to say, ‘Hey, I have a COVID-19 difficulty,’ basically they would have to forebear. Many of these forbearance plans are people simply putting money in their pocket who may or may not have a real challenge. So again, I think these numbers are inflated and not very concerning right now.
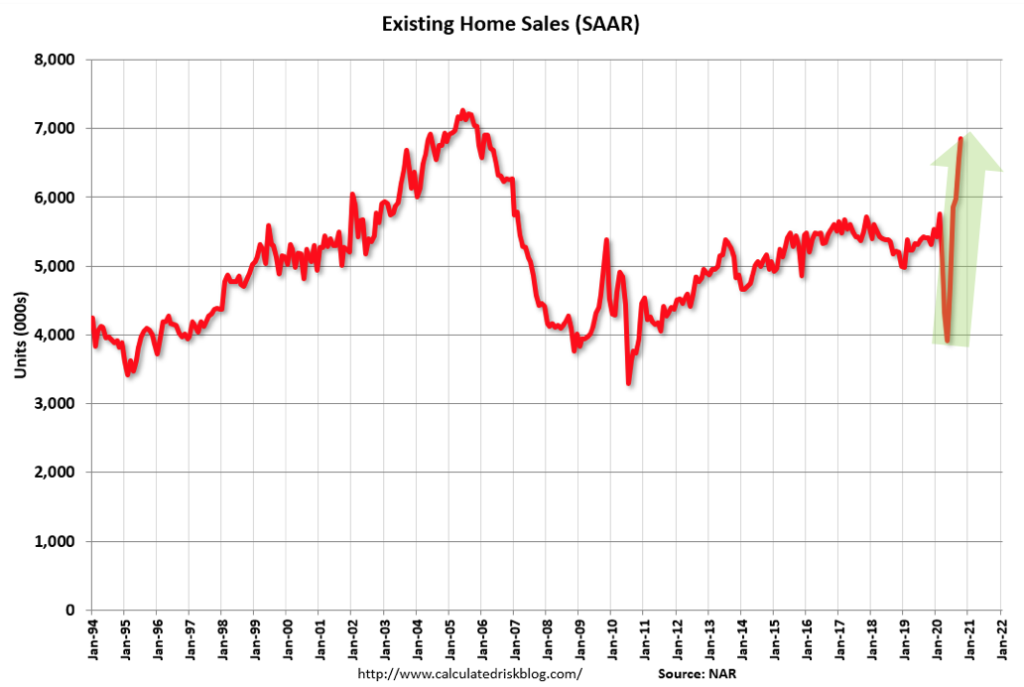
Home Sales Booming, Highest in Last 15 Years
Meanwhile, existing home sales are booming, hitting the highest point in the last 15 years. Take a look at the peak in 2005 and 2006. Even in the middle of the COVID crisis, home sales are absolutely booming.
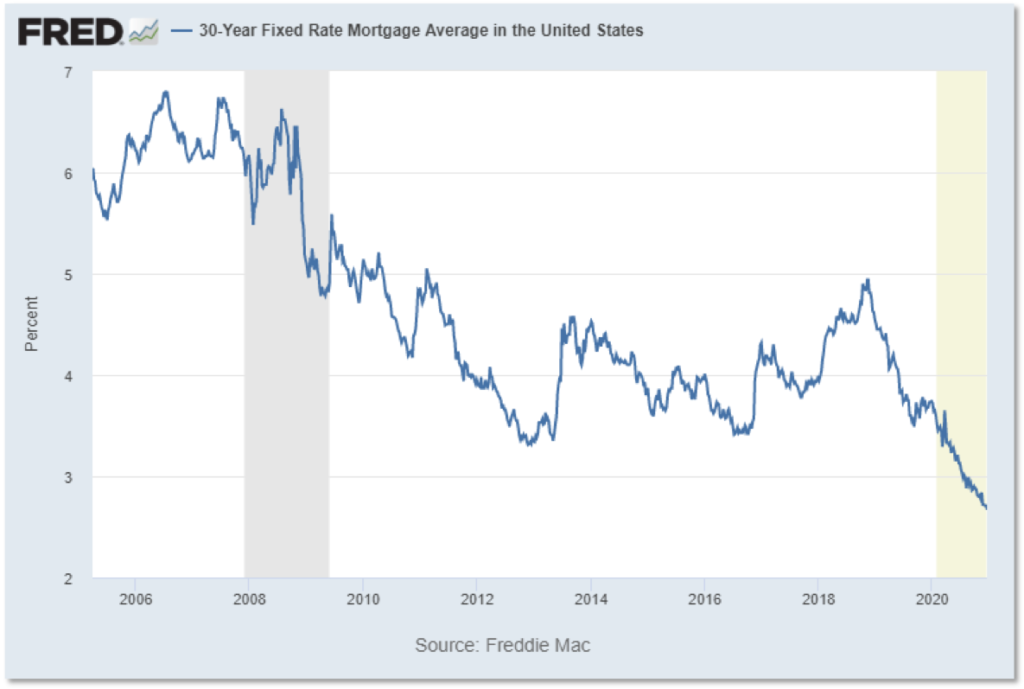
The 30-year fixed mortgage rate is one of the main reasons for home prices skyrocketing, hitting a record low of 2.67% at the end of 2020. These rates are crazy-low for a 30-year fixed mortgage. Mortgage rates have never been this low, so it creates a massive demand and stimulative effect on home prices.
Housing Prices By Metro Area
Housing prices are now above the 2006 peak except in the largest Metro areas. In the below chart, the red line is the national average. You can see the 2006 peak, how we’re now far above it.
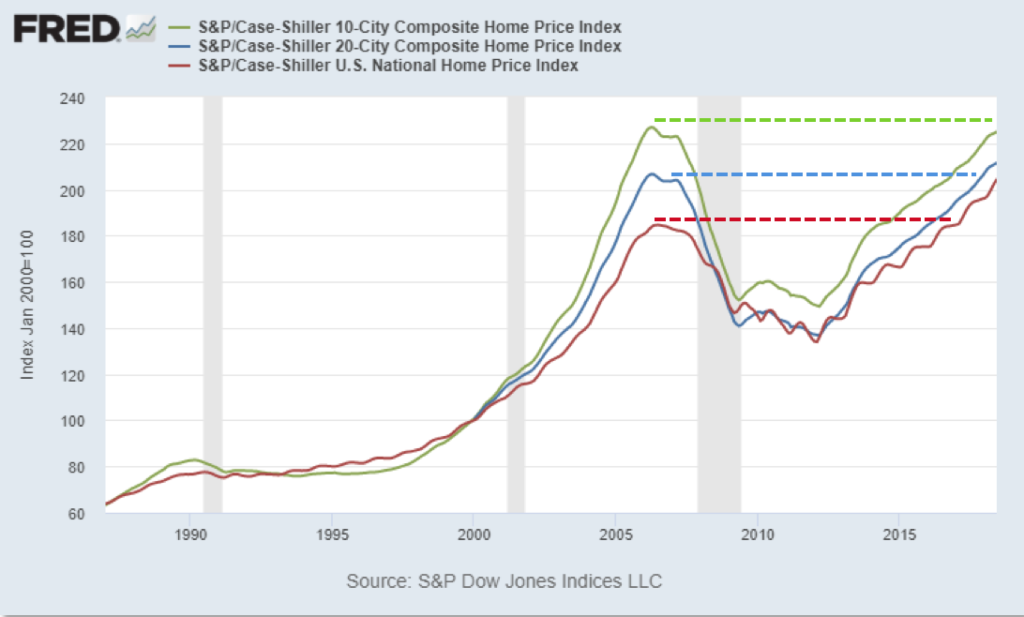
The blue line shows the largest 20 Metro areas, and we’re now just above the 2006 peak. And finally, the green line depicts the largest 10 Metros, big cities like San Francisco, New York. In these metros we are not quite at the previous peak yet. So across the board, home prices have had a pretty dramatic recovery and are now close to or above the previous peak.
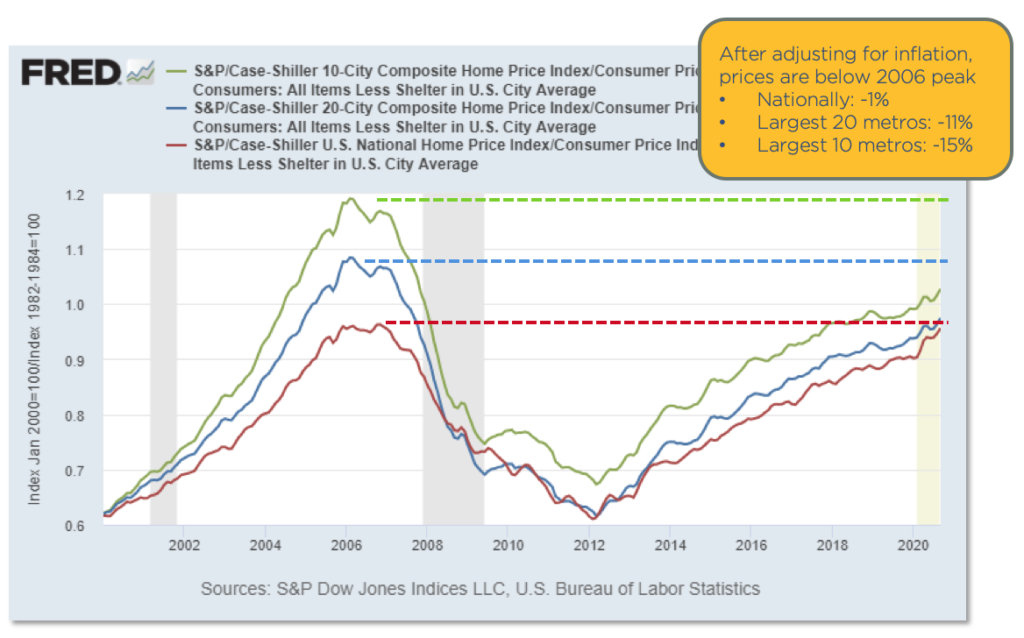
But after adjusting for inflation, let’s call it “real housing prices,” prices are still well below the peak in the largest metros, and close to the peak nationally. The chart below shows inflation-adjusted housing prices, and you can see we’re actually right about at the peak nationally. And In the 10 largest metros, we’re well below the 2006 peak. So after adjusting for inflation, nationally we’re 1% below the previous peak, and between 11-15% below the previous peak in the largest metros. So prices have not recovered to where they would be with inflation.
The Demand For Housing
Price-to-Rent Ratios Mean It’s Cheaper to Buy Than Rent
One of the major factors driving housing prices up is that it’s cheaper to buy than rent. Here’s the price to rent ratio. When it’s high, it’s cheaper to rent than to buy.
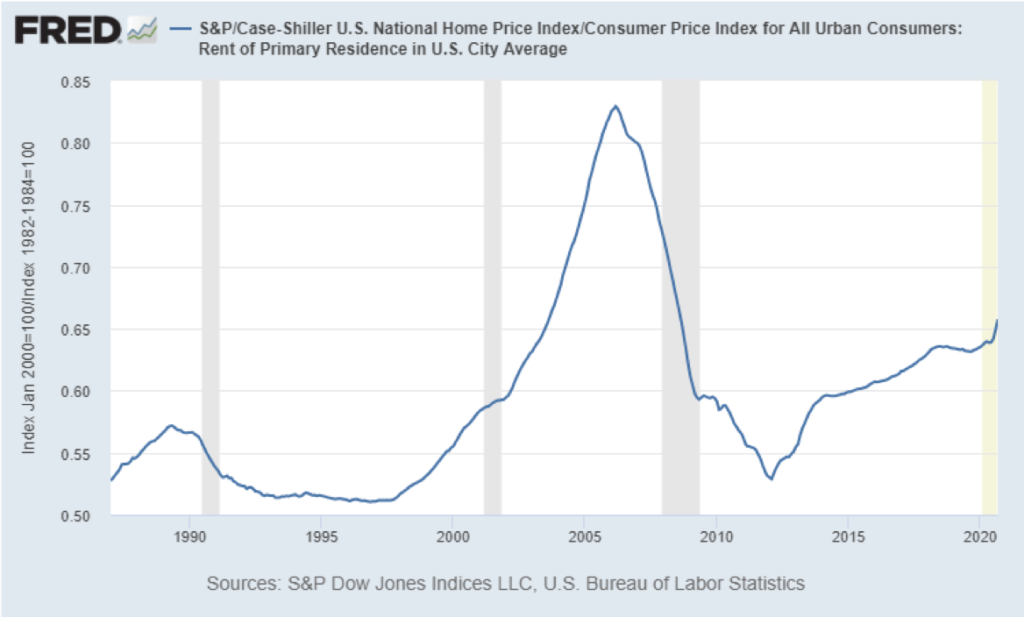
We’re still seeing prices about 20% below the peak. One of the factors we examine at Aspen Funds when we’re buying mortgages is whether the principal and interest payments of the borrower is below the equivalent rent payments. And we’re seeing sometimes the principal and interest payments are half of what you would pay if you were to rent the same house. Rents have continued to go up throughout the crisis, so it often makes it cheaper to buy than rent. If you have good credit and a down payment, it is cheaper in many metros to buy than to rent. So that’s driving up demand.
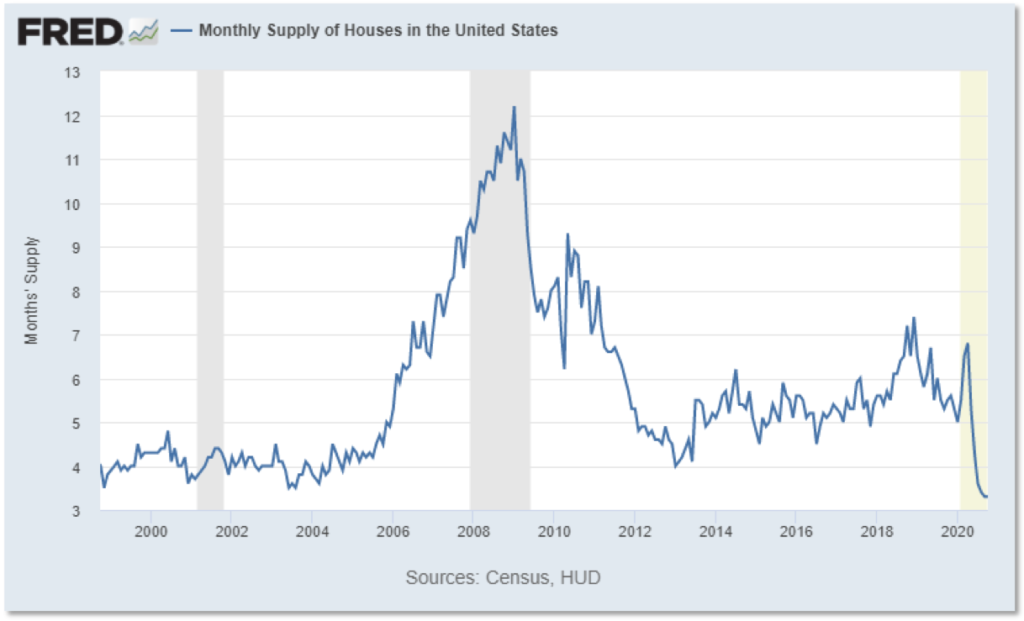
Housing Demand Driven By Supply Squeeze
The other factor at play is an acute housing supply squeeze. Today, we have only 3.3 months’ supply of houses in the US. This is an unprecedented shortage of homes on the market.
Housing Underbuilt for the Last 15 Years
Here’s the bigger story and why we have been predicting housing price gains for the past few years, including for 2021 and the next few years. The chart below measures new housing builds. The green line shows multifamily housing (structures with 5-units or more) starts and the blue line is single-family housing starts. Pre-financial crisis, everything was fairly steady and strong.
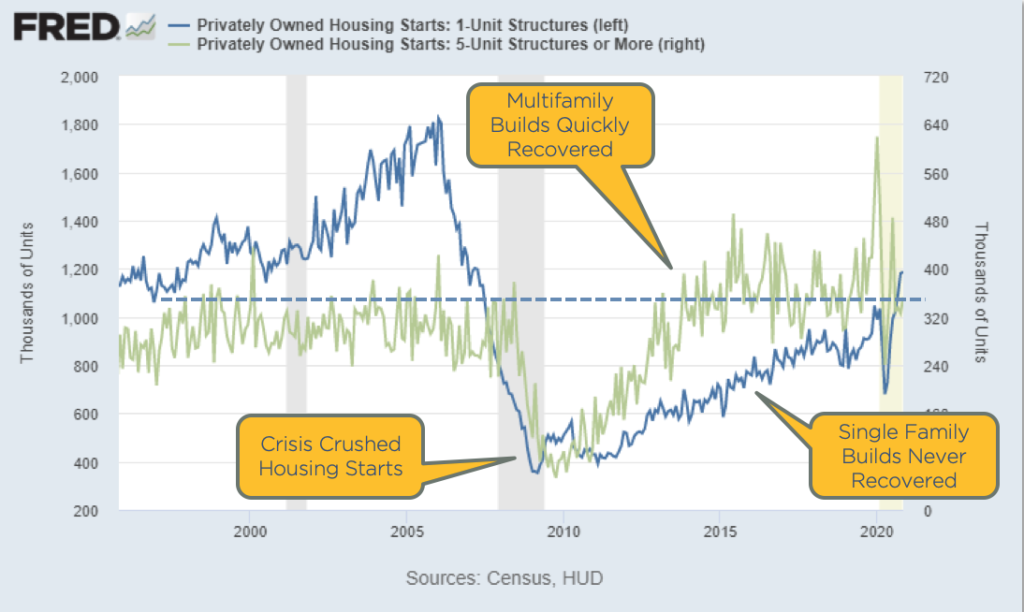
During the crisis, everything was crushed, and both multifamily and single family housing starts completely stopped. But notice what happened during the recovery: Multifamily builds recovered significantly, but single family builds never recovered. In fact, they’re still far below the lowest in the previous 20 years. Why is that?
If you built a home back in 2005, you could buy land, build a house, sell it, and you would actually make a profit. But today, if you were to buy a piece of land, build a house and sell it, you would generally not make a profit (there are some exceptions to this in the luxury market, but this generally holds true, especially at the lower end of the market).
The reason for this is because inflation has continued on for the last 15 years. The housing market took a dive, but inflation did not take a dive. So the housing market has not kept pace with inflation. Today your cost of land, building materials and labor have dramatically gone up. But prices when you sell it have not kept pace. Homes are underpriced.
There are two ways to fix this: either private homes need to be cheaper to build, which is not going to happen, or prices need to go up. This means there’s a shortage of supply coming onto the market. There are no new homes competing with existing homes, because they’re not being built. Why? Because you can’t make money doing that. This has helped to create a chronic supply squeeze.
Going back to the last chart, we’re actually seeing homes are starting to be built again. Currently, we’re still just above half of the level of new home builds as in 2006. So while there’s not a lot of homes being built, we’re starting to hit the bottom of normal range. This is a good sign to me, signaling that we’re going to see some new supply hitting the market. This housing starts line has to climb higher before we start to see any relief in housing price gains. Until then we’re going to continue to see housing prices for single family homes continue to go up.
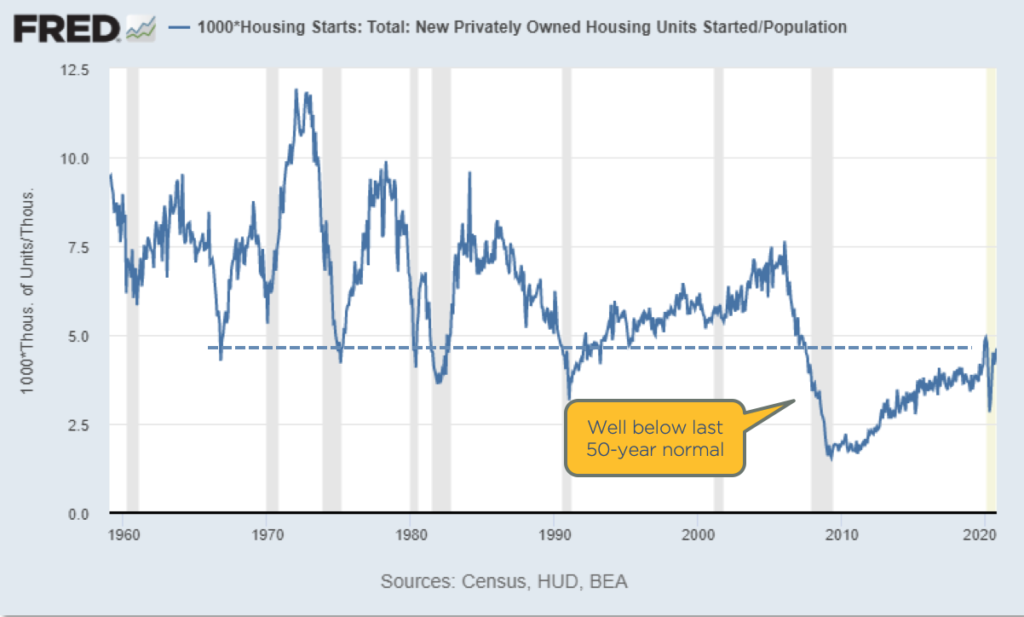
This is the same chart, except now displayed relative to population. According to this data, not only are housing starts low, but the population of the United States has continued to increase. This further illustrates the chronic undersupply of new homes being built. We will continue to see a supply squeeze until housing prices rise enough to make new homes profitable for builders.
Debt Service – Consumer is in Great Shape
Here’s another amazing chart looking at consumer debt service. The consumer is in great shape in spite of COVID.
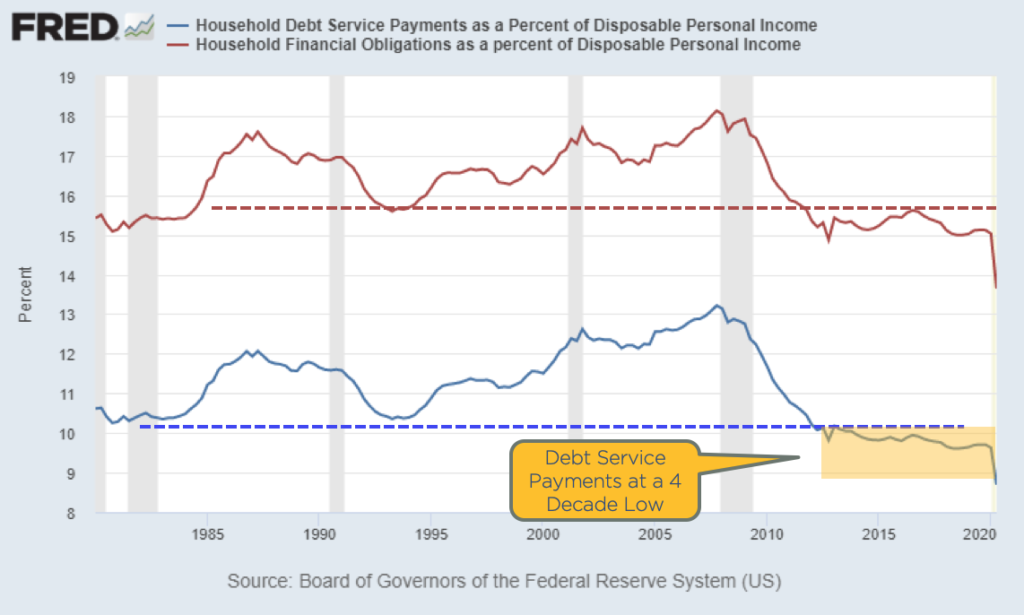
Look at the COVID impact in 2020. This is debt service payments as a percent of disposable income. Debt service is how much you spend on an annual basis on debt service relative to your income. We’ve seen a dramatic improvement in 2020 where people are spending less money on debt. Why is that? Well, income is going up, and interest rates are going down. So the consumer is actually in very, very good shape.
Housing Affordability is Increasing
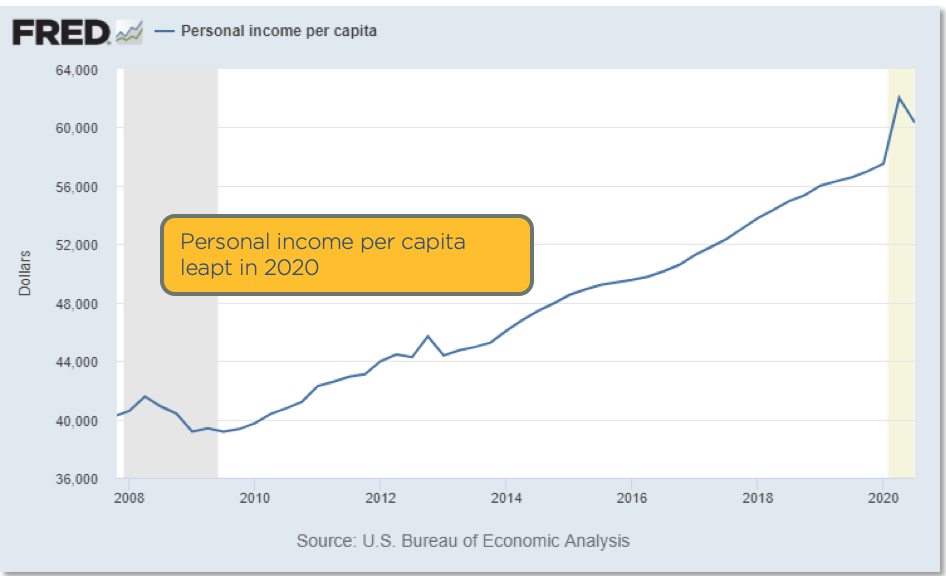
Housing affordability is increasing. Now this may be counterintuitive to a lot of people. The below chart is my version of affordability, measuring personal income per capita divided by median home interest costs. If you bought the average home in America and you got a loan at the current interest rate, what are you going to pay in interest versus what you earn? And you can see it’s actually rising dramatically. Why is that? Well personal income per capita is actually up due to stimulus payments and unemployment payments.
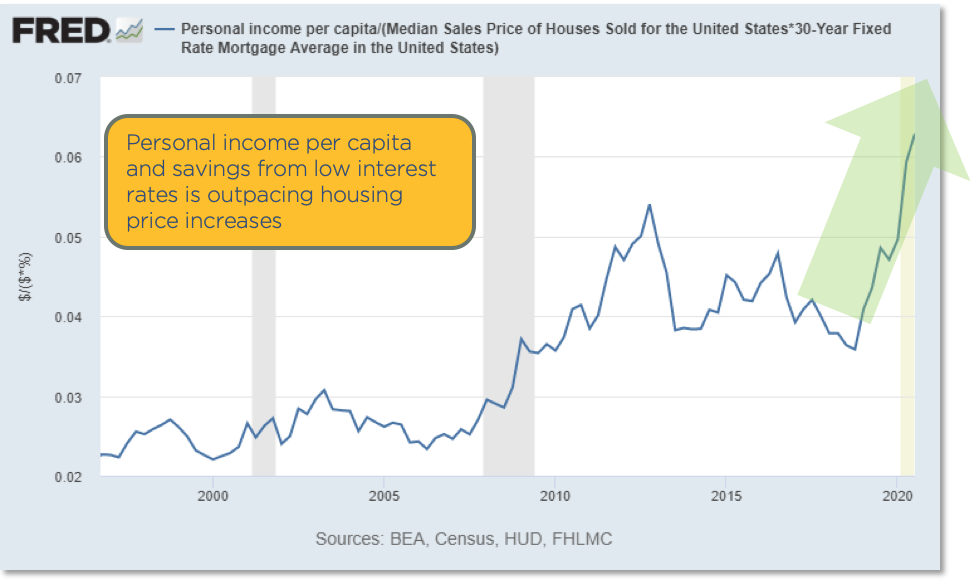
Housing affordability is improving because rising personal income per capita and savings from falling interest rates is currently outpacing the higher cost of housing. So again, it’s kind of surprising, but we’re seeing affordability going up and prices continue to rise as a result.
Are We in Another Housing Bubble in 2021?
There’s a lot of concern about a housing bubble. The chart below is current 2020 data from CoreLogic, who looks at mortgages. Today, mortgage underwriting is far more conservative than in the early 2000s. This is the share of conforming conventional homes purchased with the debt-to-income (DTI) ratio above 45%, meaning you’re spending more than 45% of your income paying your mortgage.
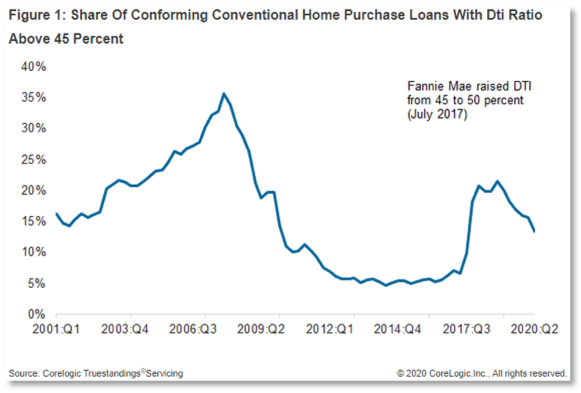
You can see 2006, which was the peak of the previous housing bubble, was at a pretty high number. Today it’s not anywhere near that.
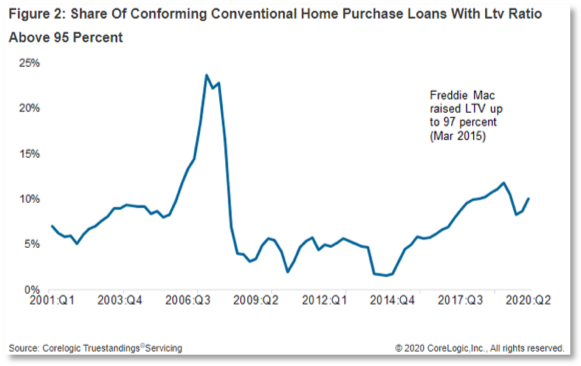
And here is the share of conforming home purchases with a loan-to-value (LTV) ratio above 95%, meaning loans with a 5% down payment or less. How many homes are bought with 5% down? Well, it was a significant number back at the peak of the housing bubble. Today it’s far lower.
Perhaps even more important is this chart, also from CoreLogic, showing six factors of credit quality. What’s interesting here is the percentage of low doc/no doc loans, of which there are almost none today. These types of loans were a significant portion of loans back in the great financial crisis. With a low doc/no doc loan, you basically state your income and don’t need to provide documentation to prove it. Today these simply do not happen a significant amount.
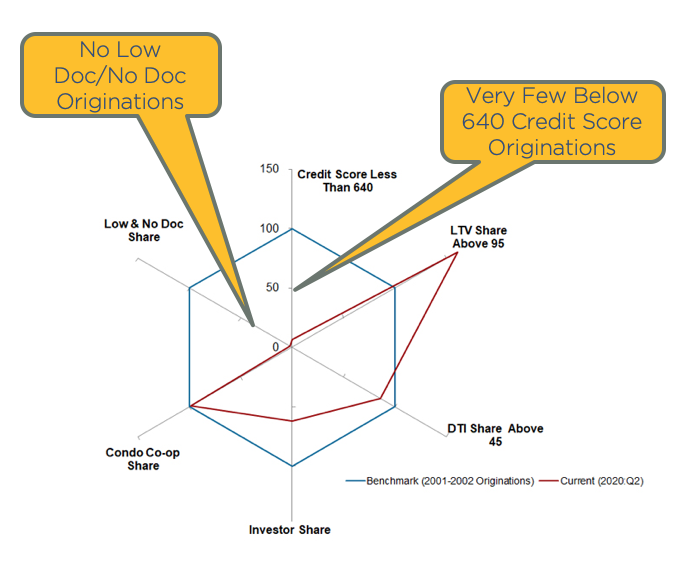
And the second factor to look at in this same chart is the below 640 credit score loan originations. Again, very, very small relative to what was happening in 2000.
Today we’re seeing every measure of origination loan credit quality is far, far more conservative than it was in 2000. Especially the greatest risk areas, below 640 credit score and no doc/low doc loans. So bottom line there’s no way we’re in a housing bubble right now.
Real Estate Forecast 2021 Bottom Line
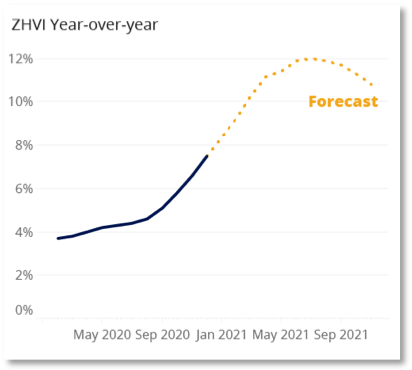
- We’re going to see record strength continue in the housing market. CoreLogic is forecasting 1.9% growth in 2021 (I don’t know how they get that number after seeing 7.3% growth in 2020). Zillow is forecasting a 10-12% growth in 2021. Our estimate is that growth will be at or above the 2020 level, so 8-10% growth in 2021. Again, this is because of all the reasons we’ve said: fewer new homes being built, low supply, low interest rates, higher affordability, low price-to-rent ratios and a consumer that is very, very healthy. Basically every fundamental we examine is strong, so we expect to see a very good year for single family homes.
- For commercial real estate, multifamily, and office, the global interest rate compression will keep cap rates low. Today global interest rates are low, zero, and negative, meaning if you put your money in a bank you would pay the bank to keep your money. Low and negative interest rates are driving cap rates down globally. So if you have $1 billion, are you going to put it in a bank and pay a bank to keep the money? No, you’ll do pretty much anything else, like buy an apartment complex, etc. This creates a massive amount of liquidity and keeps cap rates low, and cap rates determine prices. So prices are going to continue to be high for the foreseeable future.
Global interest rate compression is a byproduct of stimulus. It’s also a byproduct of policy and it’s unlikely to change anytime soon. Interest rates are going to continue to be extremely low and that is simply going to boost multifamily and office prices. I don’t know how much upside there is in those, but I don’t think there’s a significant downside. - Office demand will significantly soften as working from home becomes permanent for some or many workers. Even if the current 80% of the workforce working from home becomes 20%, that’s still 20% less demand for office space. However, since most office space is on long-term leases, impact is not immediate or acute. So we’re going to see softening, but it’s not going to be a big problem.
There is a huge opportunity in distressed properties within Retail and Lodging. As we said before, 24% of hotel lodging debt was in special servicing, which means loss mitigation. This is a huge opportunity for distressed properties possibly selling for 50 cents on the dollar, for those who want to move into that area.
Recap & Next Article
Up to this point, we’ve covered what happened economically in 2020, where we believe the economy is headed in 2021, how Biden’s proposed tax plan with impact the economy, and where the housing market is headed.
Next article in series: The Stock Market
Related Articles
2021 Economic Forecast – Pt. 1 – The Economy
2021 Economic Forecast – Pt. 2 – COVID19 Recovery
2021 Economic Forecast – Pt. 3 – The Biden Tax Plan
About the Author

Mr. Fraser has 20+ years’ experience as a finance and technology executive and is a former E&Y Entrepreneur of the Year Award winner. In 2012 Fraser co-founded Aspen Funds, a fund management company focused on mortgage investments. Fraser is responsible for financial management, portfolio modeling, as well as systems and processes, designing and deploying Aspen’s scalable state-of-the-art back-end platform.