Recently, we have been frequently asked by investors about our perspective on the economy as we head into 2020. Are we heading into a recession? When will this happen? Will it be as bad as 2008?
Obviously, this is something on the forefront of investor’s minds. But, it’s also hard to give a succinct answer. We decided to put together our thoughts on where the economy is headed and other “hot topics” that many investors are thinking about.
We will be putting together a 5-part economic series that covers a variety of topics ranging from the U.S. economy, stock market valuations, inverted yield curve, and the real estate market. If you’ve had questions about any of these topics, we hope you’ll find value in our perspectives.
Our Economic Forecasting Approach: Macroeconomic Fundamental Analysis
Before we dive into the data, it’s important to take a step back and explain our approach to analyzing the economy. The news media has not done the average investor any favors. The stock market is up one day, and down the next. Catchy headlines dominate the conversations of the commentators. There is no real synthesis of the data, just noise.
It is important to differentiate between the stock market and the economy, as they can sometimes be used interchangeably. Generally, in the long-term, the stock market follows where the economy leads. Though, in the short-term, the stock market doesn’t always act in concert, and is anyone’s guess what it will do.
But, if you study the underlying fundamental data of the economy, you’ll have a good idea what the stock market will do in the mid-long term. We call this the difference between the tides and the waves. If you look at the stock market and the barrage of daily news, you’ll have a hard time determining what’s coming. But if you study the underlying economic data you can discover identifiable trends that underpin all investment classes, just like tides.
And finally, we focus our analysis on evaluating macro-economic data, or the key drivers of the economy and the direction they are heading. Our process is simple: look at as much meaningful data as possible and determine what the preponderance of evidence is suggesting.
Now we don’t have a crystal ball, but we do hope this series will be illuminating for you and hopefully shine the light into the drivers of the U.S. Economy and where it is headed.
US Economy
Unless you’ve been living under a rock or hiding in a cave, you’ve been hearing chatter about an impending recession. With all the news media and catchy headlines, it’s hard to know what is meaningful and what is noise. Our goal with this series is to take a comprehensive look at several facets of the economy and hopefully answer many of the questions on investors’ minds.
Our co-founder and CFO, Bob Fraser, has been a longtime economic researcher with an impressive track record, and mostly reserved his economic newsletter for our investors and friends. But we want this information to get into as many investors’ hands as possible so they can be prepared for what lies ahead.
Diving in deeper, we are going to look at the US economy from a variety of factors that impact economic health: employment, household income, consumer and business sentiment, GDP growth, money printing and inflation.
Employment
Despite all the political undercurrents surrounding our president, Trump’s tax plan has actually done what it was supposed to: jumpstart the economy, and it has done so, in precisely the ways Bob forecast two years ago. Boiled down, this tax plan aimed at rewarding business owners and investors, which in turn created more jobs and boosted employment rates. And when people start working, they become optimistic and spend money.
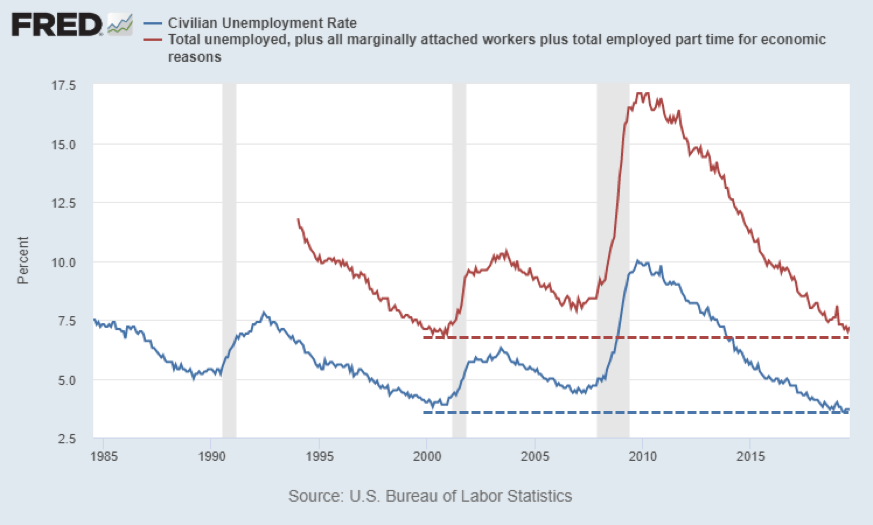
We are seeing steady gains in employment rates. Currently we are at the lowest headline unemployment rate (U3 – the number of people without a job actively looking for work) since 1969, now at 3.6%. This is the lowest it’s been in 50 years! Because 70% of the economy, as measured by Gross Domestic Product (GDP), is driven by consumer spending, low unemployment rates have a huge impact on the economy. If consumers have jobs and feel optimistic about their lives and futures, they will spend more freely, which then stimulates the economy.

Some recent claims have been made that the current state of the US economy is only helping those that are already rich, rather than the whole population. Well, the data says otherwise:
- Black unemployment rates have fallen to 5.5%, setting new record lows
- Hispanic / Latino unemployment rates, currently at 4.2%, are also setting new record lows
These are incredible trends. Minorities are getting jobs, some of them for the first time.
Think about when a person gets a job for the first time. They “enter” the economy. Well, then the GDP grows. They go buy a car, they make improvements to their house, they go to the doctor, they think about starting a business. This creates a massive amount of economic activity.
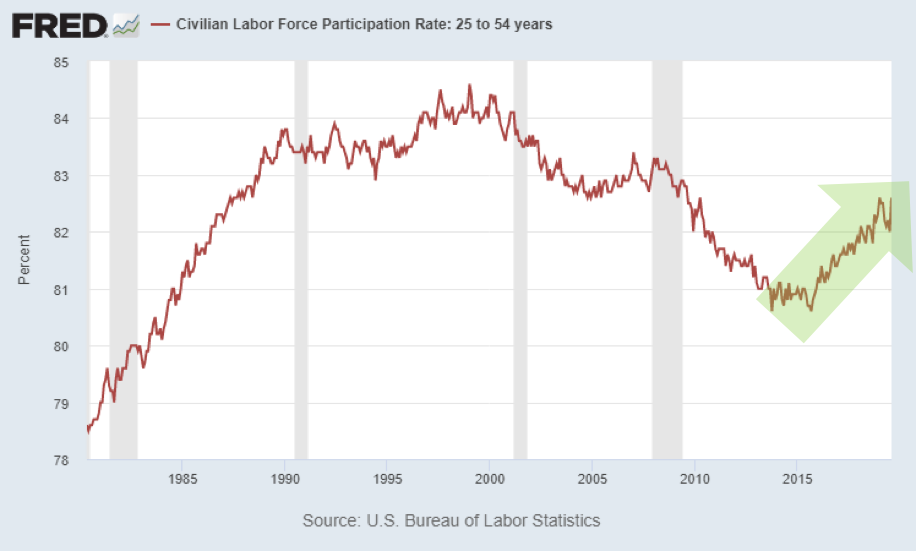
For the purposes of measuring tides, I prefer to look at broader measures of employment like the U6 rate, or the even broader labor force participation rate. This measures how many people are in the workforce relative to the entire working age population. This is important because it measures the percentage of the population that is contributing to the economy’s GDP. This measure has reversed its downward trend and skyrocketed since 2015 (despite an aging population). This signals that the population is hopeful and optimistic, so people are re-entering the economy. Whenever someone enters the economy, GDP grows.

Household Income
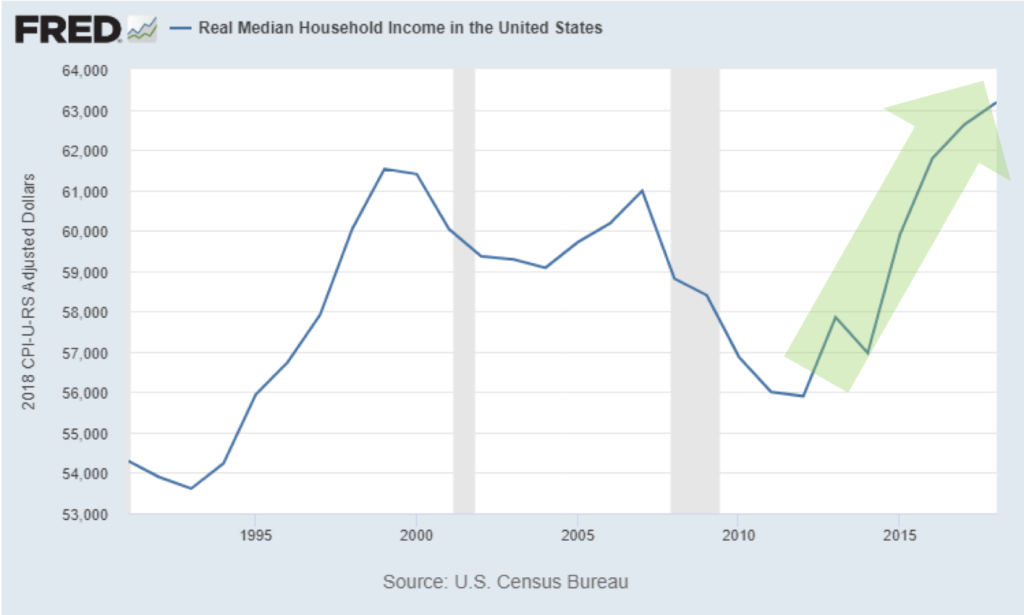
Household income is another measure that is important to consider. Real household income (which is income that has been adjusted for inflation) in the US rose during the 90s internet boom, but then has been flat or in decline since 2007. Starting in 2012, household income has completely skyrocketed. Real household income is now higher than both the late 90s and prior to the Great Recession. And this number is a median number (versus an average), meaning it’s not skewed by the wealthy making more.
Because inflation has been so low in recent years, it boosts real income growth. Each dollar goes farther. And real income is what boosts optimism. If people have some excess, they spend it – going out to the movies, to dinner, on vacation, etc. This excess contributes to a positive consumer sentiment, or optimism about the state of the economy.

Consumer and Business Sentiment
Consumer sentiment, which is an economic indicator measuring how optimistic consumers feel about their finances and the state of the economy, bottomed in 2009, but has been on a tear since 2010, though it is beginning to flatten. This indicates that despite the current political climate, consumers are still very optimistic about the economy and their finances.

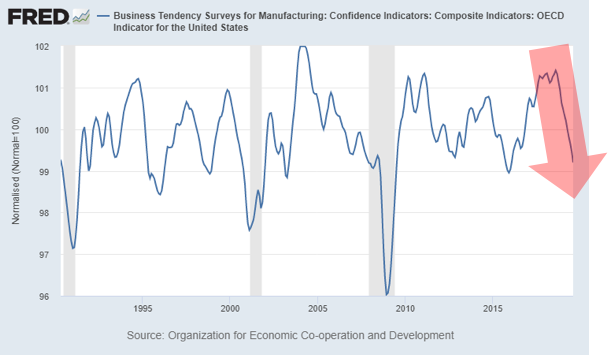
Business sentiment, on the other hand has been dropping. Business spending drives job creation and investment for future growth. If you run a business and are optimistic about your growth, you’ll go buy new equipment, hire more people, expand your operations, etc. This sentiment decline isn’t great, but it’s also not alarming.
You can see that that business sentiment changes much more frequently than consumer sentiment as they are concerned with taxation, regulation, interest rates, competition — and other factors outside general economic trends. So, it’s harder to determine clear trends in the data.
While business sentiment is important, it doesn’t bear as much weight overall as consumer spending, which again accounts for a majority of the GDP.

Stay Tuned Next Week for Part 2 of 5
Stay tuned as next week we will share the remainder of our analysis on the state of the U.S. economy. After that we will cover the inverted yield curve, the housing market, and current market valuations, and share our thoughts on whether or not a recession is coming.
If you want to make sure you don’t miss the rest of this series, sign up to receive updates and we’ll email it to you directly.


