The U.S. Housing Market 2018: Bubble or Boom?
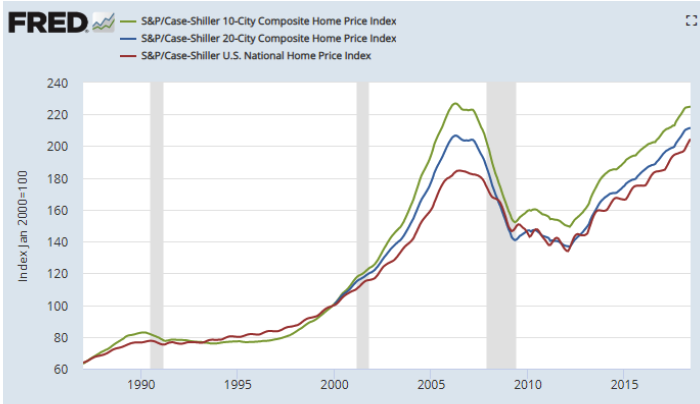
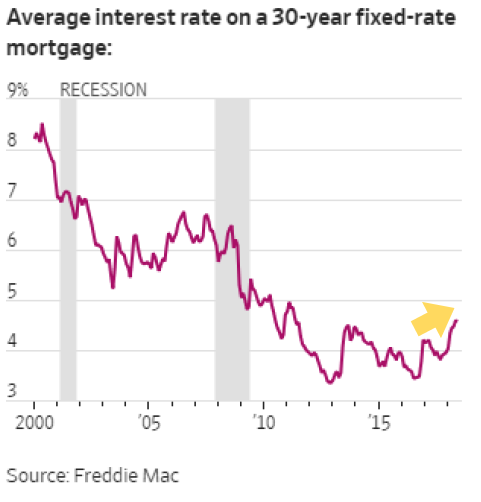
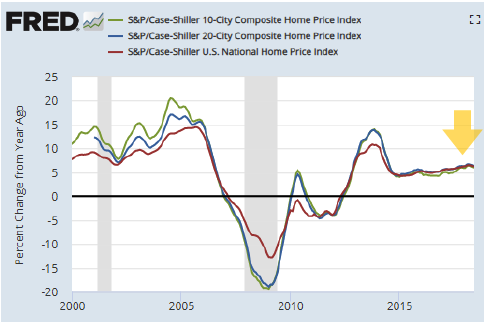
As housing prices have risen now for 5 years, thoughts of the 2005-6 housing bubble are inevitably returning. Since bottoming in February 2012, housing prices have risen steadily. In the largest metro areas, prices have fully recovered, to just below the 2006 peak. Nationwide, prices are now approximately 10% above the July 2006 peak. With interest rates rising and affordability dropping, many fear we are once again entering into housing bubble territory.
The concerns are primarily driven by rising mortgage interest rates and decreasing affordability.
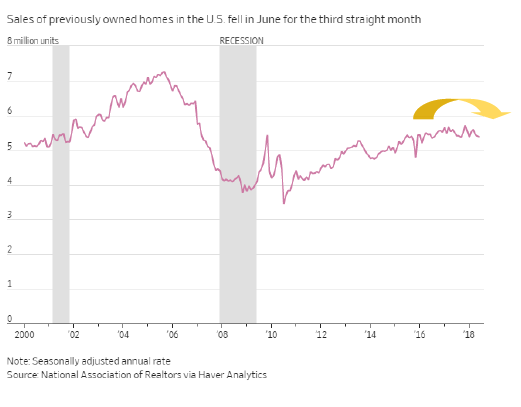
As prices and interest rates rise, home sales are slowing, causing many to predict the beginning of the end of of the bull market in housing:
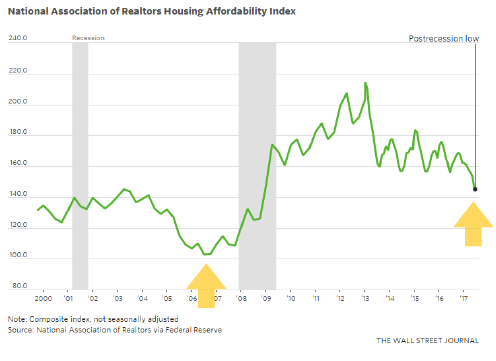
Housing affordability is indeed dropping, but housing is still more affordable than the low in 2006-7. The index below measures whether or not a typical family earns enough income to qualify for a mortgage loan on a typical home at the national and regional levels. The index is still well above the previous low in 2006-7.
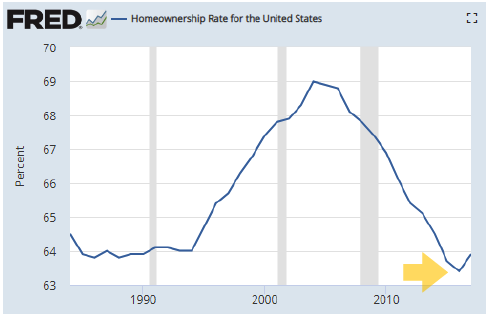
As a result of the crisis, homeownership has hit a record low, below even the home ownership rate of the 1990’s.
But despite rising prices, rising interest rates, dropping affordability and slowing sales, housing prices are continuing their relentless rise, still growing at 6% per year. In the face of these pressures, this kind of growth is re-markable, and hints at the underlying strength in the housing market.
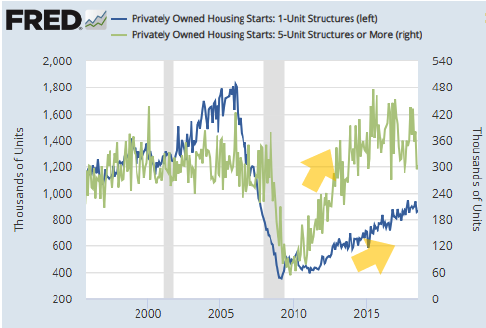
But the primary driving factor in the housing price story is the shortage of supply. Since the housing crash, single-family residential construction has never recovered to normal levels. In the chart below, you can see multifamily construction (apartment complexes) recovered quickly (the green line), but not single-family residences (the blue line). In fact, single family housing starts are still just half of pre-crisis levels:
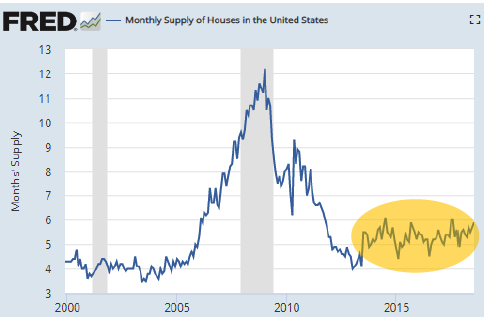
You can see this dearth of supply in the chart below. It shows the month’s supply of houses and as you can see, it has stayed relatively low and flat.
In spite of rising prices, the supply of housing for sale remains stubbornly low:
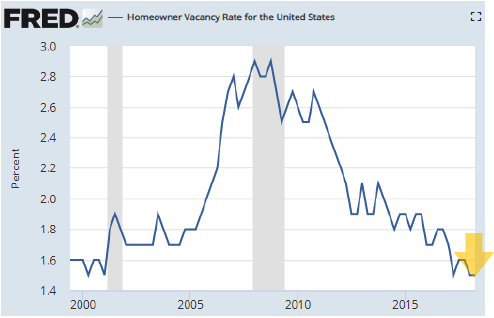
Underscoring the tightness of supply, the household vacancy is hitting record lows:
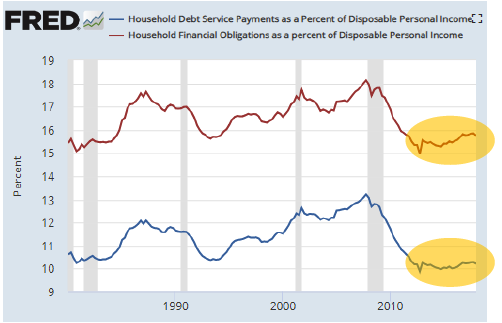
Also supporting housing prices is the health of the US consumer. In spite of rising prices, the US consumer has rarely been in better shape: Debt service payments and overall financial obligations as a percentage of disposable income is also in record low territory:
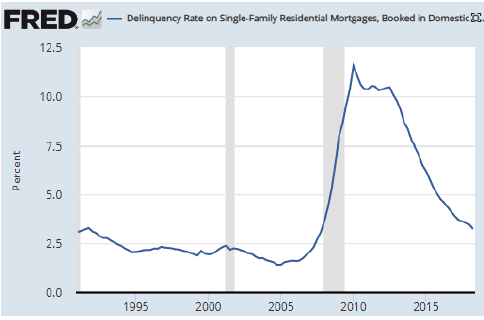
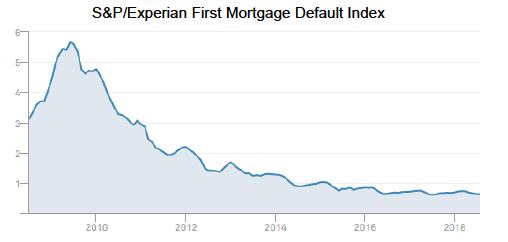
With the economy booming and the consumer healthy, mortgage delinquency and default rates are declining:
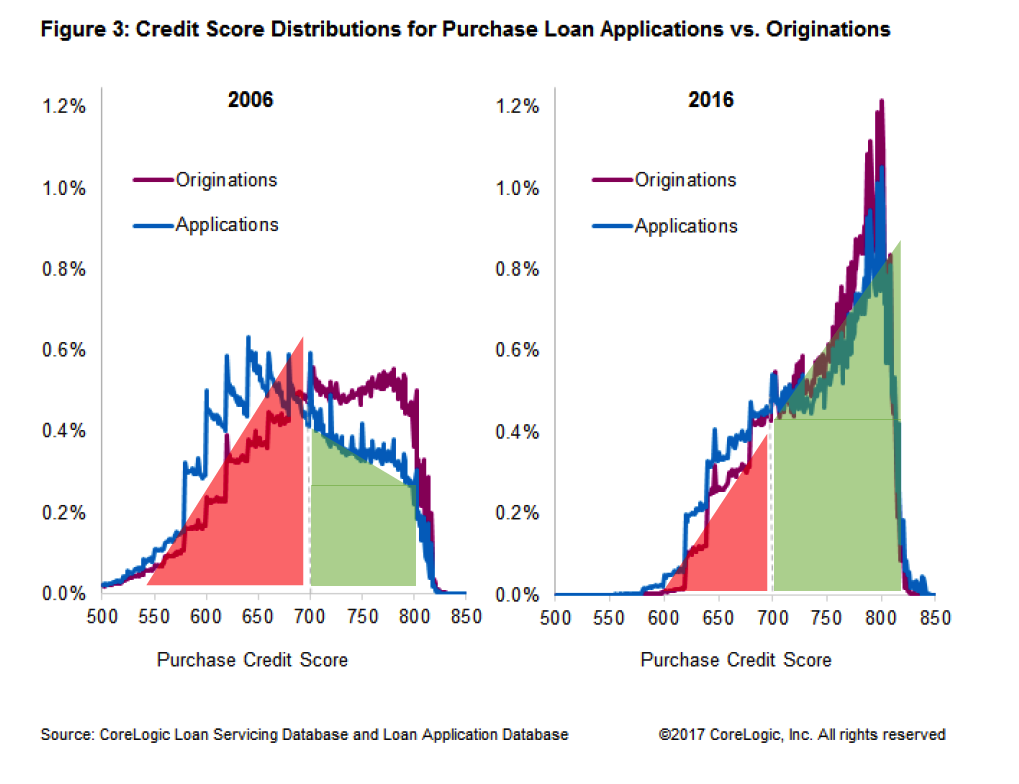
Furthermore, this rise in housing prices is not driven by speculation and loose underwriting as during the 2000-2006 period. Look at the average FICO credit score for loans made in 2006 vs. 2016. In 2006 perhaps 35% of loans were made to borrowers with a credit score below 700. In 2016, its probably closer to 15%. Credit standards are nowhere as loose as they were in 2006:
Bottom Line:
1. Housing prices are rising in spite of slowing sales.
2. Price appreciation is driven by fundamental factors, including a systemic supply shortage, and a healthy consumer.
3. Mortgage underwriting standards continue to be conservative.
It is clear to me this housing boom has legs to run for at least a few more years, and we are not yet in a speculative bubble. Certain regions of the country are obviously overheated and sales may slow, as well as the rate of appreciation, but this bull market is far from over yet.
About the Author

Fraser is the Co-Founder, CFO & COO of Aspen Funds, a fund management company focused on mortgage investments. Fraser is responsible for financial management, portfolio modeling, as well as systems and processes, designing and deploying Aspen’s scalable state-of-the-art back-end platform. Learn more about Robert.

