Note: We have a more recent economic forecast for 2021 that can be found here.
Last week we shared Part 1 of our analysis of the current state of the U.S. Economy. We covered our approach to understanding economic “tides”, U.S. Employment and Household Income, and Consumer & Business Sentiment. If you missed last week’s analysis, you can read it here: 2020 Economic Forecast – Economy (Part 1)
In Part 2 of our series, we are still analyzing the state of the U.S. Economy and will look at GDP Growth & Monetary Policy and Inflation.
Let’s dive in.
GDP Growth & Monetary Policy
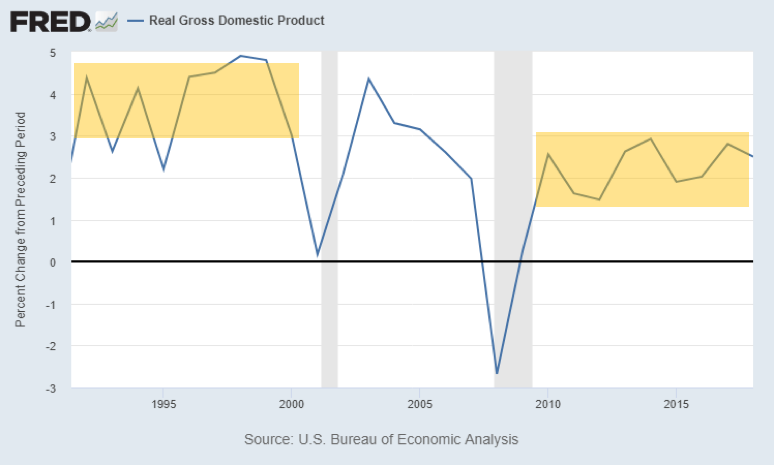
GDP is essentially the measure of economic activity in a country. This number represents the total value of all the goods and services produced in a country’s economy. We saw about a 4% real GDP growth in the 90s (during the internet boom), which was abnormally high for a mature economy. Now we’re seeing between a 1.5-3% real GDP growth since 2010. That’s solid growth. This slow but steady growth is a product of increases in productivity and the participation rate.
Meanwhile, globally, the central banks’ total assets have been increasing substantially since 2007, up until last year. When these central banks buy assets, they are essentially “printing” money to do so, sending infusions of cash into the economy and causing asset prices to go up (stocks, bonds, real estate). This is what’s been happening up until now. The Federal Reserve, European Central Bank, People’s Bank of China, and the Bank of Japan have been on massive money-printing programs since 2008. Their assets have grown from $5T total to $20T. These infusions of cash in the system act to keep interest rates low and encourage people to spend money.
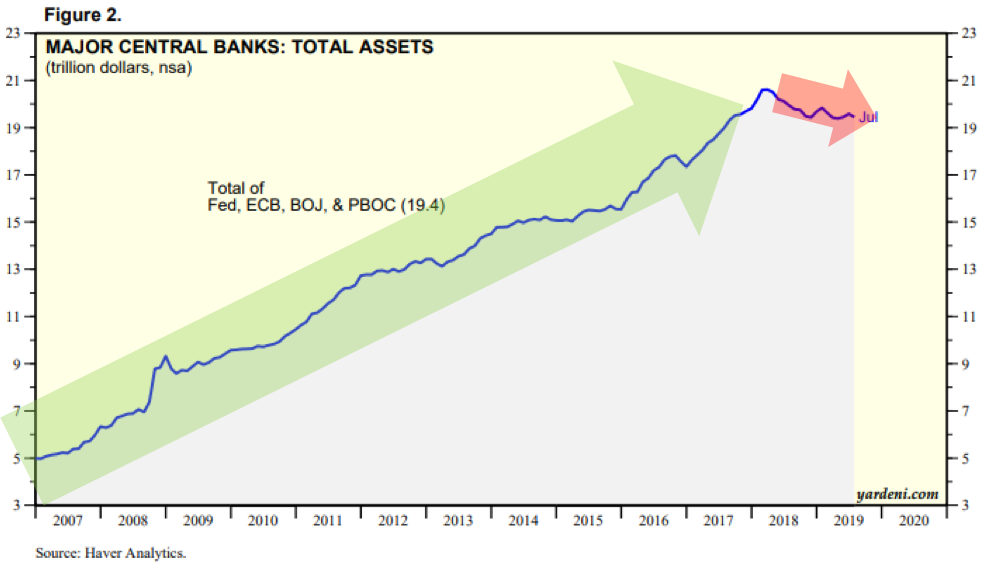
When central banks print money, this liquidity flows into asset prices, including stocks and housing. This is why we’ve seen the stock market go on a tear, even in the midst of a slower growth economy. This has created another “tide” that buoys the stock market and housing market.
Since 2018, this growth in the central banks’ balance sheets has been declining slightly, including the Federal Reserve, which has eased off printing money. But the global economy is still awash in liquidity. And because the central banks have used an easy monetary policy before, without negative consequences, there’s nothing to stop them from doing it again if the economy begins to suffer.
Historically, the common belief was that easy monetary policy, like what we’ve seen in the last decade, would cause a rampant inflation, potentially even hyper-inflation. But, as we’ll cover in our next section, there are many systemic deflationary forces in the economy. These deflationary forces have prevented the monetary policy from creating unwanted inflation.
Inflation
The Federal Reserve’s mandates are generally to keep the unemployment rate low, as well as maintain price stability. And in spite of the global easy money policies, and against common wisdom, since inflation has remained stubbornly low. Inflation is basically non-existent right now and we predict will continue to be for the next decade, if not longer. The Fed’s inflation measure increased only 1.4% over the last 12 months. The reason inflation has hardly risen is because there are massive deflationary forces at work, holding inflation at bay.
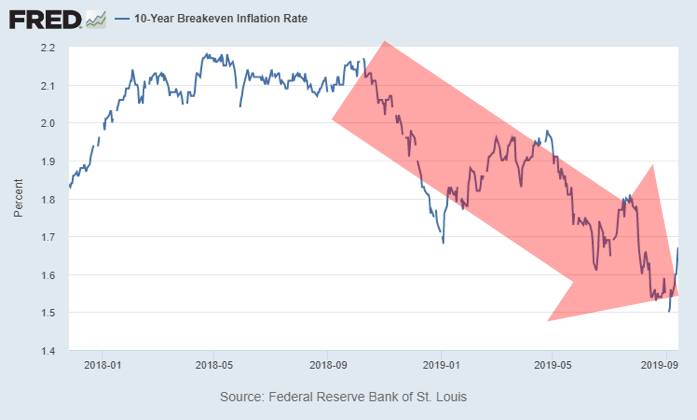
There are 2 kinds of inflation: asset price inflation and consumer price inflation (CPI). Asset price inflation (i.e. stock market and housing prices) has been increasing substantially. But CPI has been flat. CPI has 3 main inputs, which are all in systemic, deflationary trajectories: wages, energy, and commodities. These long-term trends are keeping inflation relatively flat.
Wage Deflation
Manufacturing output has gone up since 1970 (first chart), however manufacturing jobs have steadily decreased (second chart). Why is this? Productivity, automation, better equipment. This is happening across many industries.
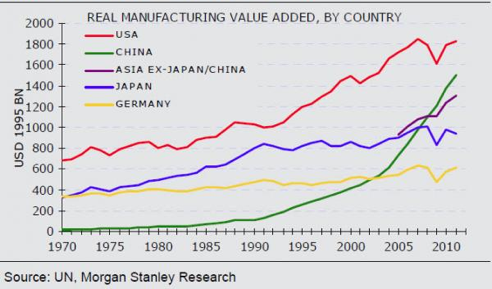
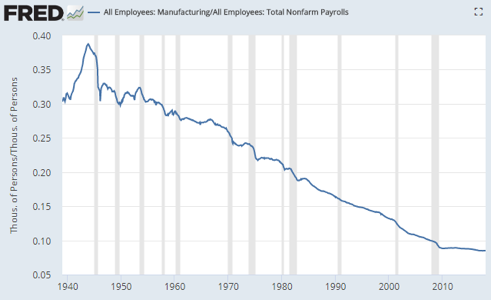
We have massive wage deflation primarily due to automation, aging population, and globalization. According to McKinsey, by 2030, 23-44% of current work hours will be automated. This means that between 8-33% of the workforce will need to change occupations.
Jobs like those in customer service will decrease with the rise in online systems. Efforts are underway to build automated burger flippers. Self-driving vehicle advances could replace Uber drivers and truck drivers in the near future.
While those with specialized skills can continue to earn more in a wealthier world, the rise of robotics and other technological advances provides a significant deflationary force on the median wage globally. As jobs disappear, more people are making less wages, compressing the median wage. Essentially, automation creates a cap on wages. At some point it’s cheaper to buy a million-dollar robot than to pay employees an inflated wage.
So what does this mean for the job market? Over the next 10 years we will see unemployment rates go up and participation rates go down, unless we see the economy remain strong and we retrain people to do jobs less susceptible to automation and keep unemployment low.
On top of this, demographically, the workforce is getting older and the working population is expected to fall as the global population growth rate slows. This will create downward pressure on potential growth and inflation.
Food Deflation
Despite grainland area being harvested dropping significantly, the yield per hectare is increasing disproportionately. Rises in production output are due to global biotechnology advances which are significantly improving yields. In some parts of the world, we can now see multiple harvests from the same hectare within a calendar year.
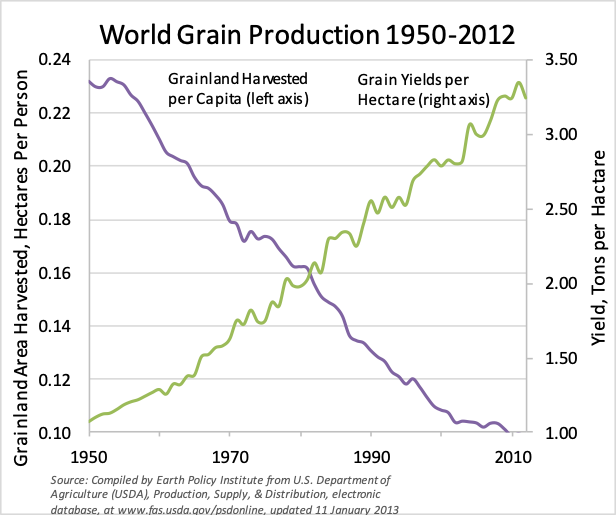
Additionally, global trade has expanded such that food supply is now worldwide. We import and export grain, produce, and other commodities quite commonly. This insulates us from regional production shocks and shortages caused by droughts or other weather anomalies. These trends also act as deflationary forces.
Oil Deflation
In the 1970’s, oil was the major factor driving global inflation. Does anyone remember the Arab oil embargo? But many are surprised to hear that the US is now the largest producer of oil in the world. How did this happen? New technologies like horizontal drilling and fracking. Regardless of what you think about these technologies, they have unlocked massive amounts of oil reserves. On top of that, US energy consumption is now flat (this is due to a variety of factors like moderate GDP growth, populations driving fewer miles and using more efficient cars, and less trucking). So, if consumption is flat, production is soaring, then prices will fall. What will happen when US-pioneered production advances are deployed in the giant and super-giant oilfields in Russia, Saudi Arabia or Indonesia? We will never in our lifetimes see $100 oil again. By the time these technologies run their course, electric vehicles will be the dominant form of transportation and oil consumption will be in permanent decline.
Bottom line
There is still a lot of strength in the fundamentals of the economy: unemployment is near record lows, GDP growth is solid, consumer sentiment is high, and inflation is being kept in check. These are all positive signals for the economy.
Obviously, the long-term deflationary trends in wages are concerning, but those won’t create significant impact on the economy for some time.
Stay Tuned Next Week for Part 3 of 5
Stay tuned for parts 3-5 on the economy covering the stock market valuations, inverted yield curve and the housing market. After we cover those, we’ll share our thoughts on whether or not a recession is coming.
If you want to make sure you don’t miss the rest of this series, sign up to receive updates and we’ll email it to you directly.


