Note: We have a more recent economic forecast for 2021 that can be found here.
Happy New Year! Hopefully, you’ve been enjoying the past articles on the economy and stock market valuations as we head in 2020, and have found some insights valuable. This will be the fourth article in our 5-part series. If you missed any of the last three articles, you can read them here:
- 2020 Economic Forecast – US Economy (Part 1)
- 2020 Economic Forecast – US Economy (Part 2)
- Stock Market and Valuation Forecast
In Part 4 of our series, we are going to discuss a topic many investors have heard of or seen headlines about – the inverted yield curve.
Let’s dive in.
Does the Inverted Yield Curve Signal an Impending Recession?
If there’s one economic headline that caused a lot of stir recently, it was the news the yield curve had inverted. This inversion has many investors in a panic about the future of the US economy. In the headlines it is typically touted as a sure-fire indicator of an upcoming recession (“An inverted yield curve has predicted the last 7 recessions”). And while we agree it is something to take note of, we have a slightly different outlook.
But we’ll get to that.
First, let’s look at what the yield curve is and why it inverts.
What is an Inverted Yield Curve?
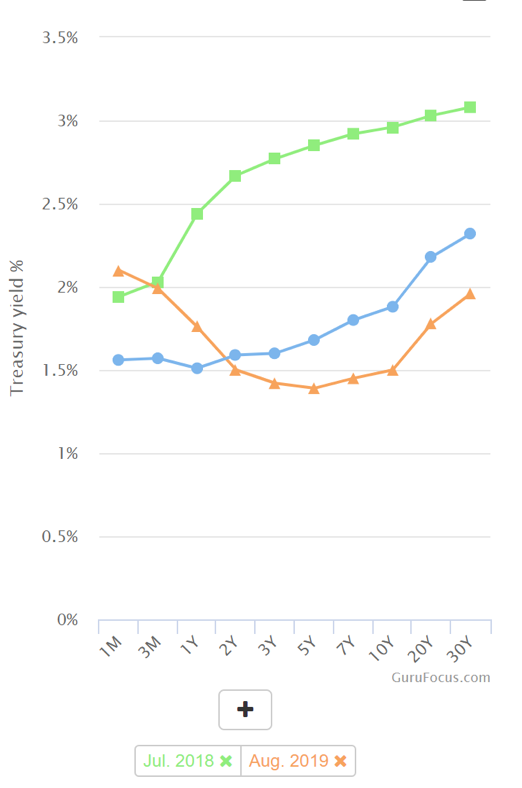
When you buy a bond, you receive interest payments in return, giving your bonds a “yield.” Typically, the longer the term of the bond, the higher yield you receive. For example, take a look at the yield curve chart below. Look at the green line, which is the “normal” yield curve from the summer of 2018. If you lent your money for 3 months, you would receive a 2.03% yield. If you went out to a year, you would get 2.44%; 10 years, 2.96%, and so forth.
But last summer, the yield curve inverted – meaning that longer term investments produced smaller yields. Look at the orange line. If you invested for 1 year, you would get a 1.76% yield, but if you lent for 10 years you would get just 1.5%.
Today’s yield curve (the blue line) is much more pedestrian, just a slight inversion between 3 months and 1 year.

Why Does the Yield Curve Invert?
Historically, watching the yield curve was helpful to see investors’ appetite for risk. Generally, investors will move more money from the stock market into the “safety” of bonds when they perceive greater risk in the economy. There has been a recent influx of cash into the bond market, and many are tying this to the volatility of the stock market. When investors pile into bonds, it drives down the long-term yields. (It’s worth noting that short-term bond yields are determined by the Federal Reserve’s monetary policy, while long-term bonds are dictated by the bond market. That’s why they change independently of each other.)
Now, this can happen when investors are pessimistic about the future of the economy or the stock market. But there are a lot more factors at play in the bond market that are important to consider.
What’s All the Fuss About an Inverted Yield Curve?
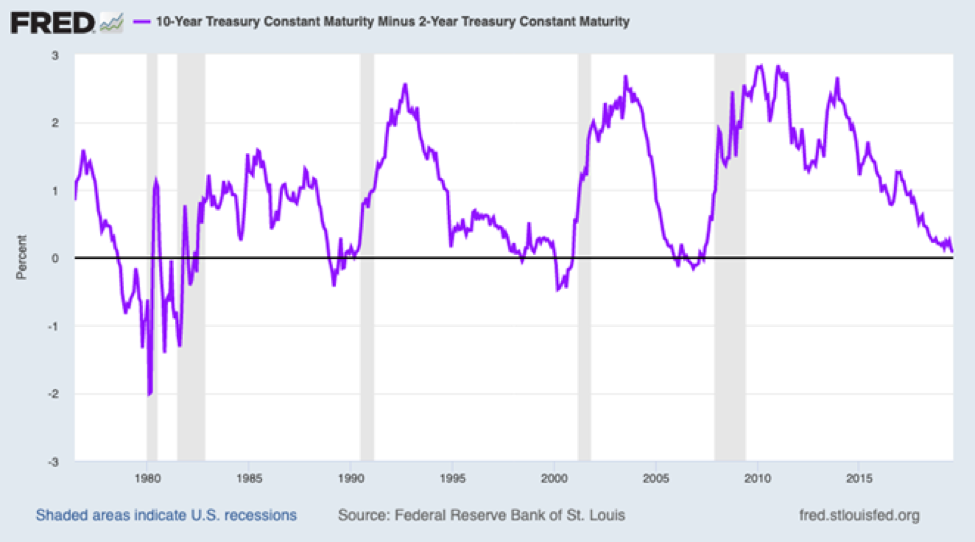
Here’s why many people are alarmed: an inversion of the yield curve has pre-dated a recession every time it has happened in the last 40 years. It’s surprisingly been a fairly accurate early indicator of recession, generally occurring 18-36 months before a recession.

Because of its historical accuracy, alarm bells went off when the yield inverted recently. And while an inversion is cause to investigate what is going on, we think it’s premature to say that the next recession is now inevitable.
In fact, we believe that a yield curve inversion has much less predictive power than it once did.
Here’s why.
Why the Inverted Yield Curve Might Not Be an Indicator of a Recession
Based on our research, there are 4 key factors that are creating “noise” in the yield curve. This noise is what makes an inversion a much less reliable indicator.
- First, we’ve been in a long-term low-inflation period and will continue to be for a while (we covered some of these macro-trends in part 1 of this series). Low expected inflation, means lower expected future growth, which dampens long-term yields.
- We also have an aging population and slowing population growth. This will generally cause long-term yields to decrease. Overtime, a larger percentage of the population will not be productively participating in the economy which lowers potential GDP growth.
- Another overlooked factor contributing to the inversion is that the Fed has been buying bonds since the last economic crisis in 2008, driving yields down. The Fed’s monetary policy has created a price-insensitive buyer of bonds, which creates distortion in the market.
“The predictive power of this indicator requires greater context following the Federal Reserve’s unprecedented monetary accommodation during the financial crisis in 2008,” says Phillip Nelson, the Head of Asset Allocation at NEPC in Boston. “The central bank’s large balance sheet has driven Treasury term premiums to historic lows, potentially enabling more frequent yield curve inversions without the associated risk of a recession” (source). - Perhaps one of the biggest contributors to the noise in the yield curve is the global interest rate environment. The bond market is now not just indicative of the U.S. economy, but also reflective of the global reality. Several central banks have created negative interest rates. This creates a scenario in which lenders are effectively paying the government to borrow their money. As larger institutional investors, in Europe for example, are looking for yield and the only domestic option are bonds with negative interest rates, a better option is to invest US bonds with a currency hedge. International money has been moving into the US bond market, creating a lot of noise. The yield curve is now no longer just a predictor of US growth, it’s a predictor of US growth plus the lack of growth and yields of other countries’ markets.
The inverted yield curve has had predictive power in the past, but given all these reasons, it’s clear there’s a lot of extra noise in the bond market that makes this much less significant than it has been in the past. Capital Economics agrees: “Inverted yield curves in the US and elsewhere tell us very little about the timing of the future downturns and, for now at least, the economic data are more consistent with a slowdown than a downturn in the world economy” (source).
Or as the South China Morning Post puts it: “While an inverted yield curve could be taken as a sign that a recession is in the offing, US manufacturing activity and consumer sentiment remain robust. The inversion in US yields is more a by-product of excessively low yields in Europe and Japan” (source).
The Bottom Line
We’ll cover our view in more depth in our final post of this series, but in our view, record low unemployment and solid wage growth in the US, where 70% of economic activity is derived consumer spending, means we are extremely unlikely to see a recession anytime soon. The inverted yield curve is noteworthy, but more reflective of strangeness in the bond market than an impending recession.
The Final Post in our Economic Series
In the final part of our series we are going to be covering a topic we get asked questions most often on and is probably most relevant to our investors – the state of the U.S. housing market. There are a lot of factors to consider, so the next article will be dense with data, but we hope it will be very illuminating.
And as always, please feel free to share this with any investors you think would benefit.
If you want to make sure you don’t miss the rest of this series, sign up to receive updates and we’ll email it to you directly.


