The 6th and final part of this series on the economy in 2021 takes a look at Aspen Funds. This part covers the fund strategies, performance throughout 2020 and the COVID crisis, and positioning moving into next year.
See below for parts 1-5 of this economic series.
Aspen RPN Strategy – Income Fund
In our re-performing notes (RPN) strategy used by our Income Fund, we buy discounted first and second liens and hold for income and cap gains.
The notes in this strategy are called re-performing because at one point the borrower was not making their payments, and then they began making the payments again. This doesn’t mean there is anything wrong with the home, only that the borrower had trouble. But we find that typically borrowers recover. Because these loans are re-performing, we are able to buy them at a discount.
So in essence, we buy notes on single family residences and we hold them, receiving the mortgage payments and capital gains. Because we buy these mortgages at a discounted rate, when a note is refinanced or a home is sold, we recover that discount and make money.
This strategy is very well positioned for 2021 and what’s on the horizon. As we looked at in the housing market portion of this forecast, increasing home values flow through to our equity. This has been the case for the last 8 years. Additionally, low mortgage rates encourage refinancing. Our fund benefits when we get refinanced out of a loan, because our note gets paid off and we recover any discount in that loan that we received from a discounted purchase price. In our estimation, 2021 will be a good year for this strategy.
Portfolio Details
We have an 8-year track record operating in this strategy today. Our fund has about 500 loans in its portfolio across the United States.

Second Liens
About 65% of our portfolio is discounted second liens, about 342 loans.

In many cases we prefer to buy a second lien over a first lien. Here’s an example to explain why. Let’s say there’s a $300,000 house, with a $100,000 first lien, and a $100,000 second lien. You could buy that first lien without a discount on it, and it would be at a 4% interest rate. You’d earn 4% on that loan.
But let’s say I could buy the $100,000 second lien, which is a lower priority than the first. But it has an 8% interest rate, and I can buy it at a discount of 50 cents on the dollar. So my return doubles and I’m actually earning 16% on that loan. If I buy it at 50 cents on the dollar, then I only pay $50,000 for that $100,000 note. And so when it pays off, I actually have a capital gain of $50,000 in addition to the interest collected from monthly payments. So in many cases, the second liens are far superior and we prefer to own those in our portfolio.
So with the 342 second liens that make up this portion of our portfolio, on average we own the notes at 55 cents on the dollar. That means we have paid $55,000 for a $100,000 loan.
These loans are fairly safe with an average 67% ITV, meaning the liens on these homes (at our cost) are only two-thirds of the value of that home. So there is 33% in equity in the value of the home above us.
Our scheduled yield is 13.8%, assuming that all mortgage payments are made on time. That’s the contractual yield on that after the discount.
First Liens
We also own 149 first liens, which make up 27% of our Income Fund portfolio. On average, we bought them at 73 cents on the dollar, a 27% discount from the face value.

These loans are even safer with a 57% average investment to value ratio. So these loans have very deep equity and very little risk. We have a 12% gross scheduled yield on those loans.
Hard Money Loans
The third and final part of our portfolio is hard money loans. These make up 7% of our portfolio with 13 loans.

COVID-19 Resilient
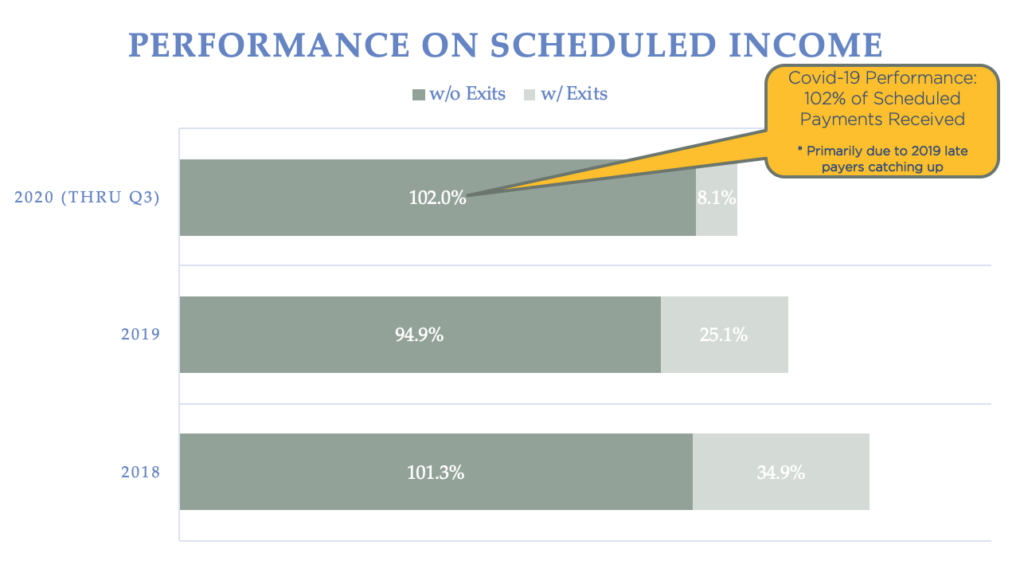
Our Income Fund has proven to be COVID-19 resilient. The below chart shows our performance on scheduled income, as the contractual payments that we expected to receive if everyone paid on time. In 2020 through Q3, we’ve received 102% of contractual payments. This is more than what we expected primarily due to those with late payments in 2019 catching up. In December 2019, a fraction of people were late and that rolls into the next year. The bottom line is we’ve proven to be fairly COVID-19 resilient, and with the economy likely turning early in the first half of 2021, we’re very optimistic about the performance of this fund.

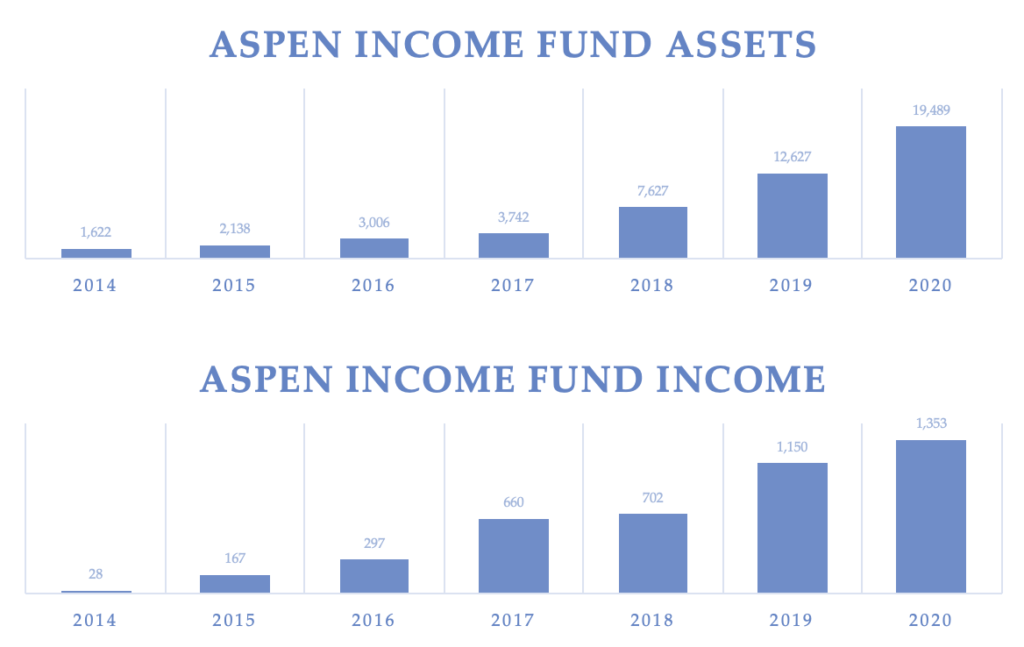
Below are our basic financials for the Income Fund over the last seven years of operating the strategy, including our assets and income. This fund has a strong operating history and a healthy outlook for 2021 in our opinion.

Aspen NPN Strategy – Growth Fund
Our second strategy is our non-performing note (NPN) strategy, used by our Growth Fund. In this strategy we buy discounted, residential non-performing second liens, where the senior lien is performing. These homes are typically owner occupied. So with this strategy, we’re buying a second lien that’s not being paid where the first lien is being paid, and we fix this loan.
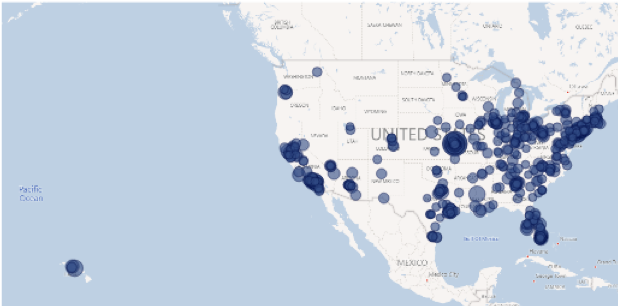
Our strategy here is to buy these loans at a discount and to execute one of seven exit strategies. Our current portfolio is spread across four growth funds, 1,269 loans in 46 states all over the United States. Our average payoff is $91,000, and our average acquisition price is $21,000. So we basically pay, on average, 31 cents on the dollar. Our median home value is $300,000.

In our NPN Strategy, we have seven exit strategies.

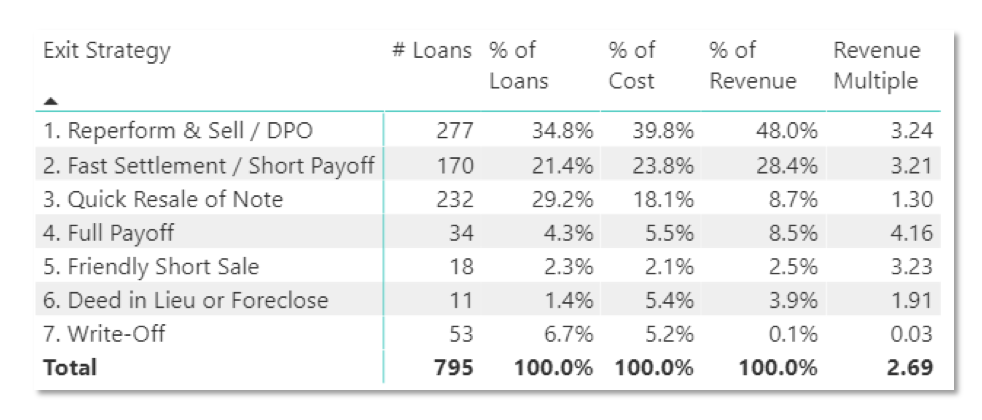
We have had 795 exits over the last 8 years across four operating funds. Our most common exit strategy is to modify the loan. We talk with a borrower, come up with a payment plan that they can afford, and we re-perform that loan. Once we modify the loan and get it performing again, we sell the note. We’ve done this with about 35% of our loans, generating about 48% of our revenues. This turns into a revenue multiple of 3.24X.
Our second largest exit is a fast settlement / short payoff. In this strategy, we may have a $25,000 note and we’ll settle for $15,000 with the borrower, wiping out their debt and fixing their credit. We’ve done this with about 21% of our loans, generating 28% of our revenues. This turns into a revenue multiple of 3.2X.
Overall, our average return across all 7 exit strategies is a 2.69X multiple over the last 8 years.
This NPN strategy is very well positioned to benefit from 2021 economic trends, primarily due to increasing home values. These home values flow through to our equity, and we find borrowers are more willing to work with us to position themselves to capture home equity growth. If a homeowner knows that their home value has been going up 5% per year, with likely more to come, they’re more likely to want to capture that equity and build their own wealth, rather than let it all go away to a non-performing debt.
Borrowers’ capacity is increasing due to personal income and savings rate increasing, and the COVID-19 crisis will undoubtedly generate a new wave of NPN notes available for purchase, perhaps in the beginning of 2021. Both of our strategies are poised to benefit from the current economic situation.
Recap
Up to this point, we’ve covered what happened economically in 2020, where we believe the economy is headed in 2021, how Biden’s proposed tax plan with impact the economy, where the housing and stock markets are headed, and how Aspen’s funds are positioned moving into 2021.
Related Articles
2021 Economic Forecast – Pt. 1 – The Economy
2021 Economic Forecast – Pt. 2 – COVID19 Recovery
2021 Economic Forecast – Pt. 3 – The Biden Tax Plan
2021 Economic Forecast – Pt. 4 – Housing Market
2021 Economic Forecast – Pt. 5 – Stock Market


